Free Trade Agreements and U.S. Agriculture
Contact:
Printer-Friendly PDF (580.72 KB)
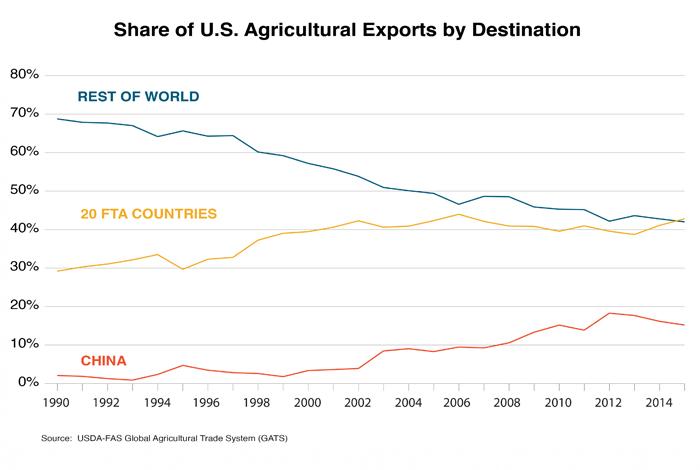
Free Trade Agreements (FTAs) help expand foreign markets for U.S. producers and exporters by reducing trade barriers, fostering a more stable and transparent environment for trade and investment, protecting U.S. economic interests, and enhancing the rule of law. To date, the United States has 14 FTAs in force with 20 countries that account for 43 percent of total U.S. agricultural exports to the world. The United States also has concluded negotiations on the Trans-Pacific Partnership (TPP) and is in the process of negotiating the Transatlantic Trade and Investment Partnership (TTIP), which are expected to further enhance U.S. agricultural export opportunities.

U.S. Exports to FTA Countries Grow Faster Than to the Rest of the World
The current 20 U.S. FTA partner countries represent 10 percent of the world’s GDP and 6 percent of global population, yet they account for 43 percent of U.S. agricultural exports to the world, up from 29 percent in 1990, before the majority of U.S. FTAs were implemented. In contrast, the share in U.S. agricultural exports corresponding with the rest of the world (excluding China, which soared as a U.S. market after World Trade Organization (WTO) accession in 2001) dropped from 69 percent to 42 percent.
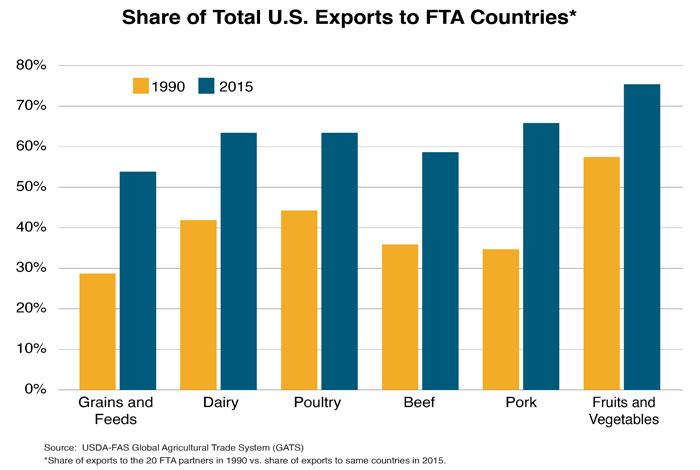
Under FTAs, the majority of U.S. export products enjoy an immediate tariff reduction to zero upon entry into force, with most of the remaining tariffs phased out over time. Immediate improved access is also achieved through duty-free tariff-rate quotas (TRQs) that are sometimes included for sensitive commodities, often leading to full tariff elimination eventually. U.S. exports of the following products to FTA countries had increases of 15 percent or more between 1990 and 2015 as a share of U.S. exports to the world: grains and feeds, dairy products, poultry and products, beef and products, pork and products, and fruits and vegetables. Among these, corn exports to FTA countries had one of the most dramatic growth rates, rising from 22 percent of total U.S. corn exports to 60 percent. A primary reason for the surge was the expansion of TRQs and eventual elimination of all tariff and quota barriers in Mexico to U.S. agricultural exports under the North American Free Trade Agreement (NAFTA). Poultry, beef, and pork exports also increased substantially due to NAFTA, one of the oldest and most comprehensive FTAs the United States has enacted.

NAFTA
NAFTA subsumed the Canada-U.S. FTA, which took effect in 1989, and created a free-trade area involving the United States, Canada, and Mexico. In the 21 years since NAFTA’s implementation in 1994, U.S. agricultural exports to Canada and Mexico have more than quadrupled, growing from $8.9 billion in 1993 to $38.6 billion in 2015. Canada and Mexico’s share of total U.S. agricultural exports to the world has increased from an average of 19 percent (1990-93) to 28 percent (2012-15). Before the agreement, Canada was the fourth leading U.S. market. It is now the number one market for U.S. agricultural exports, and by far the largest U.S. market for high-value consumer-oriented products. Mexico’s imports of feedstuff from the United States are closely linked to its burgeoning poultry and pork industries. It is the top market for U.S. corn, soybean meal, and poultry, as well as the second largest market for U.S. pork.
Analysis by USDA’s Economic Research Service (ERS) found that NAFTA fostered deep integration of North American agricultural markets, characterized by increased cross-border trade of raw material, intermediate inputs and outputs, higher foreign direct investment (FDI), and greater institutional and policy cooperation and coordination (link). Such market integration allows participants to benefit more from their relative strength and spurs more efficient allocation of economic resources. Producers have access to potentially cheaper inputs and FDI, as well as new opportunities to sell their products, though they could face more competition as well.
Increasing intraregional trade also benefits consumers, with access to more competitively priced products, new varieties of food, and off-season supplies of fresh produce. For example, trade liberalization has facilitated U.S. imports of grape tomatoes and fresh avocados from Mexico, while Mexico has become the largest market for U.S. apples and pears. For tropical fruits such as bananas, mangos, pineapples, and others, imports have been filling the demand gaps from a lack of or inadequate U.S. production.
Other FTAs
U.S. agricultural exports to Central America and the Dominican Republic more than doubled after the Dominican Republic-Central America Free Trade Agreement (CAFTA-DR) went into effect, from $1.9 billion in 2005 to $4.2 billion in 2015. The Dominican Republic is the largest market within CAFTA-DR. At $1.1 billion, U.S. exports to the Dominican Republic constitute 27 percent of total shipments to CAFTA-DR. FAS Santo Domingo reports that CAFTA-DR has established a more transparent process for trade and helped expand imports of high-value products such as red meat, poultry, and cheese, products that had previously faced restrictions. As a result, U.S. exports of consumer-oriented products have more than quadrupled since 2005, led by dairy, beef, pork, poultry products, and prepared food.
U.S. exports to Colombia more than doubled within three years of the beginning of FTA implementation, with rapid growth of corn, soybeans, and soybean meal. The U.S.-Colombia Trade Promotion Agreement also helped catapult the country from the 21st largest U.S. market to the 9th, and U.S. market share in Colombia jumped from 23 percent in 2011 to 50 percent in 2015. Elsewhere, U.S. market share of agricultural imports by Chile and Peru also had remarkable expansions following entry into force of trade agreements. In Chile, U.S. market share grew from 9 percent in 2003 to 15 percent in 2015, led by feeds and fodders, poultry, dairy, beef, pork, and wine and beer. U.S. market share in Peru nearly doubled from 16 percent in 2008 to 30 percent in 2015, with corn, soybean oil and meal, and dairy products expanding the most.
Overall, there is a remarkable contrast between FTA and non-FTA countries in terms of U.S. market share. At 40 percent, aggregate U.S. market share in FTA partner countries is much higher than that in non-FTA countries, which is only 11 percent (or 9 percent, if China is excluded). This dichotomy between the two groups means that on the whole, U.S. exports are much more competitive with FTAs than without.
| 2015 Agricultural Trade and U.S. Market Share | ||||||
| | U.S. FTA Partners (Imports) | Non-FTA Partners (Imports) | ||||
| All FTAs | NAFTA | Non-NAFTA | Total | China | Rest of World | |
| Billion US | Billion US | |||||
| World | $135.9 | $59.3 | $76.6 | $703.4 | $110.5 | $592.9 |
| U.S. | $54.8 | $38.7 | $16.1 | $78.9 | $23.4 | $55.5 |
| U.S. Market Share | 40% | 65% | 21% | 11% | 21% | 9% |
| Source: Global Trade Atlas (GTA); GTA includes trade data from 88 countries representing more than 90 percent of world trade. | ||||||
Although in general U.S. exports to FTA countries are growing faster than to non-FTA countries, at times market conditions supersede effects of trade liberalization. For example, U.S exports to Korea fell following the 2012 entry into force of the U.S.-Korea FTA (KORUS), largely due to declines in the two largest export categories: corn and beef. Corn normally comprises over one fourth of U.S. agricultural exports to Korea, but the historic 2012 U.S. drought slashed this share to just 4 percent in 2013. U.S. beef exports surged in the two years before KORUS due to the worst outbreak of foot and mouth disease in Korea in history and fell in 2012 as Korean herd levels and beef production returned to more normal levels.
Outside of these extraordinary circumstances, U.S. exports of consumer-oriented products to Korea saw a 23-percent increase between 2011 and 2015. In particular, tree nuts, fresh fruit, prepared food, and dairy all had double digit growth. Under the KORUS agreement, U.S. cheese enjoys a zero-duty TRQ that expands annually until all U.S. imports enter duty-free after 15 years. U.S. cheese exports to South Korea grew an impressive 50 percent between 2011 and 2015, while U.S. market share also increased steadily, from an average of 20 percent during the four years before implementation to an average of 35 percent after. Market share of U.S. nonfat dry milk (NFDM) in Korea soared from 3 percent in 2011 to 23 percent in 2015.
TPP and TTIP Expected to Enhance U.S. Competitiveness
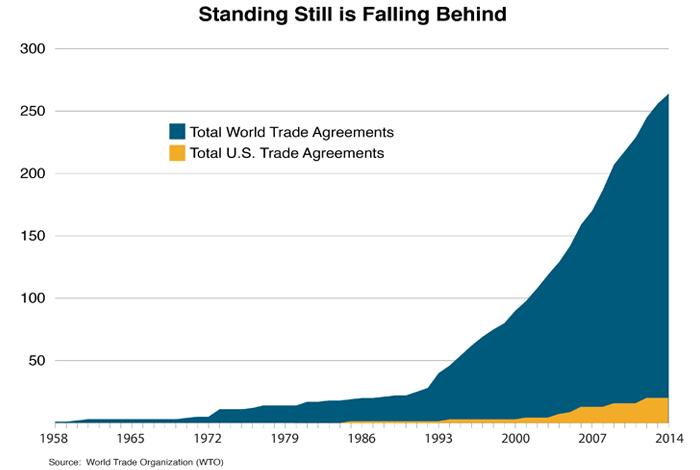
The United States has one of the overall lowest tariff rates for agricultural products in the world, averaging 5 percent. On the other hand, many of the largest U.S. export markets have much higher tariff rate averages, such as 17.0 percent in Vietnam, and 23.3 percent in Japan. Since the early 1990s, bilateral and regional trade agreements have proliferated, a trend that’s likely to continue. According to the WTO, there are currently 267 bilateral or regional trade agreements in force. The United States is only party to 14 such agreements. A USDA ERS analysis shows that an increase in trade among FTA member countries is often accompanied by trade contractions from non-member states (link). In other words, U.S. suppliers are at a disadvantage compared to those in other countries that have negotiated and implemented more trade agreements.

TPP represents 11 percent of the world’s population and 36 percent of its total GDP. The U.S. International Trade Commission (ITC) estimates that by 2032, the TPP would increase U.S. exports by $7.2 billion annually and total agricultural output by $10.0 billion over the baseline projections (link). According to the American Farm Bureau Federation, passage of the TPP would boost net U.S. farm income by $4.4 billion annually over levels expected if Congress fails to ratify it (link). USDA ERS projects that the proposed TTIP between the United States and the EU could potentially boost U.S. exports by $9.6 billion annually (compared to the 2011 base year) with removals of tariffs, TRQs, and select nontariff measures that act as technical barriers to trade or unjustified sanitary and phytosanitary (SPS) barriers (link). With 187 new regional trade agreements currently notified to the WTO and more in the works, U.S. producers need trade agreements to remain on an even footing with competitors.
| U.S. Agricultural Exports, Pre-FTA vs. 2015 | |||
| Trade Agreement | Year of Implementation | U.S. Exports Year Prior to Implementation (million US) | Current (2015) U.S. Exports (million US) |
| Israel FTA | 1985 | $308.8 | $464.1 |
| NAFTA | 1994 | $8,928.6 | $38,564.8 |
| Canada | 1989 | $2,019.0 | $20,869.1 |
| Mexico | 1994 | $3,618.6 | $17,695.6 |
| Jordan FTA | 2001 | $95.4 | $237.2 |
| Chile FTA | 2004 | $144.1 | $810.5 |
| Singapore FTA | 2004 | $266.3 | $674.4 |
| Australia FTA | 2005 | $410.2 | $1,413.8 |
| Morocco FTA | 2006 | $164.4 | $307.0 |
| Bahrain FTA | 2006 | $14.8 | $60.4 |
| CAFTA-DR | 2006-09 | $1,883.5 | $4,167.2 |
| Guatemala | 2006 | $455.3 | $1,073.2 |
| Honduras | 2006 | $248.7 | $586.8 |
| El Salvador | 2006 | $238.6 | $497.7 |
| Nicaragua | 2006 | $125.1 | $219.7 |
| Dominican Rep. | 2007 | $629.0 | $1,132.1 |
| Costa Rica | 2009 | $608.0 | $657.7 |
| Peru TPA | 2009 | $424.5 | $1,063.6 |
| Oman FTA | 2009 | $76.8 | $63.5 |
| KORUS | 2012 | $6,976.3 | $6,038.9 |
| Colombia TPA | 2012 | $1,123.4 | $2,420.7 |
| Panama TPA | 2012 | $493.7 | $653.2 |
| Source: USDA FAS Global Agricultural Trade System | |||
