Prospects for U.S. Corn in Latin America
Contact:
Printer-friendly PDF (421.91 KB)
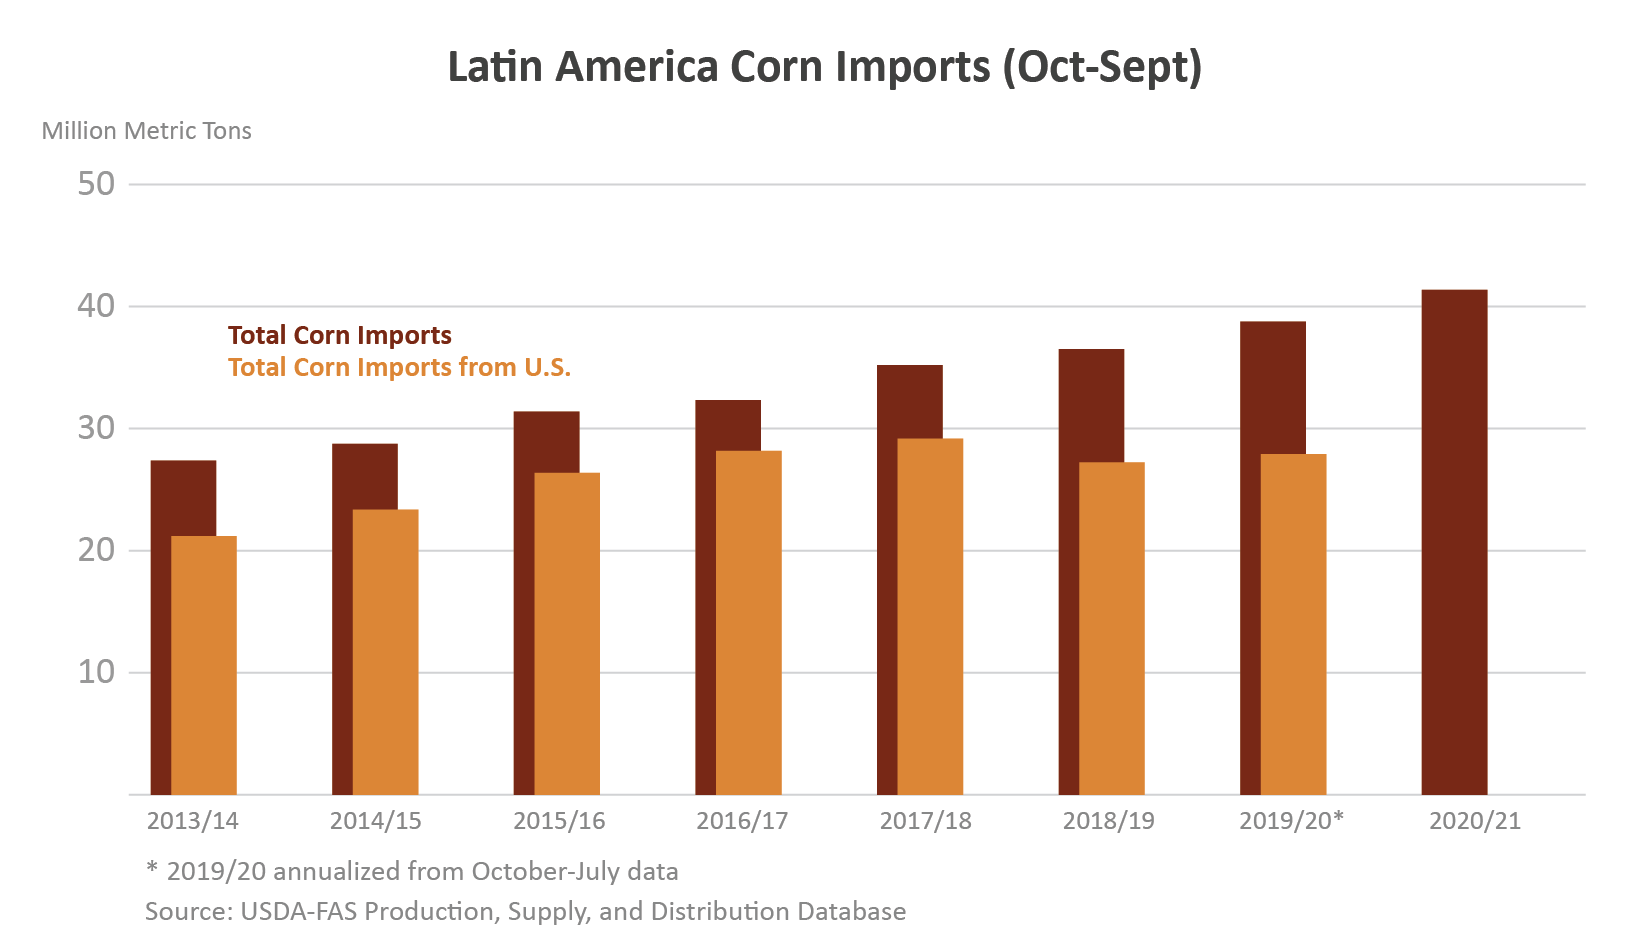
Latin America accounts for about 25 percent of global corn imports1. The region’s corn demand for imported corn has grown steadily over the years supported by expansion in the livestock sector, particularly poultry production. Demand for animal protein has grown with improved economic conditions and greater disposable incomes. Corn trade in the region for the first half of 2020 has been steady with little impact from COVID-19. The United States has been the top supplier benefitting from Latin America’s growth in imports. However, imports of U.S. corn have been trailing off, driven by changes in the key markets of Colombia, Peru, and Mexico.
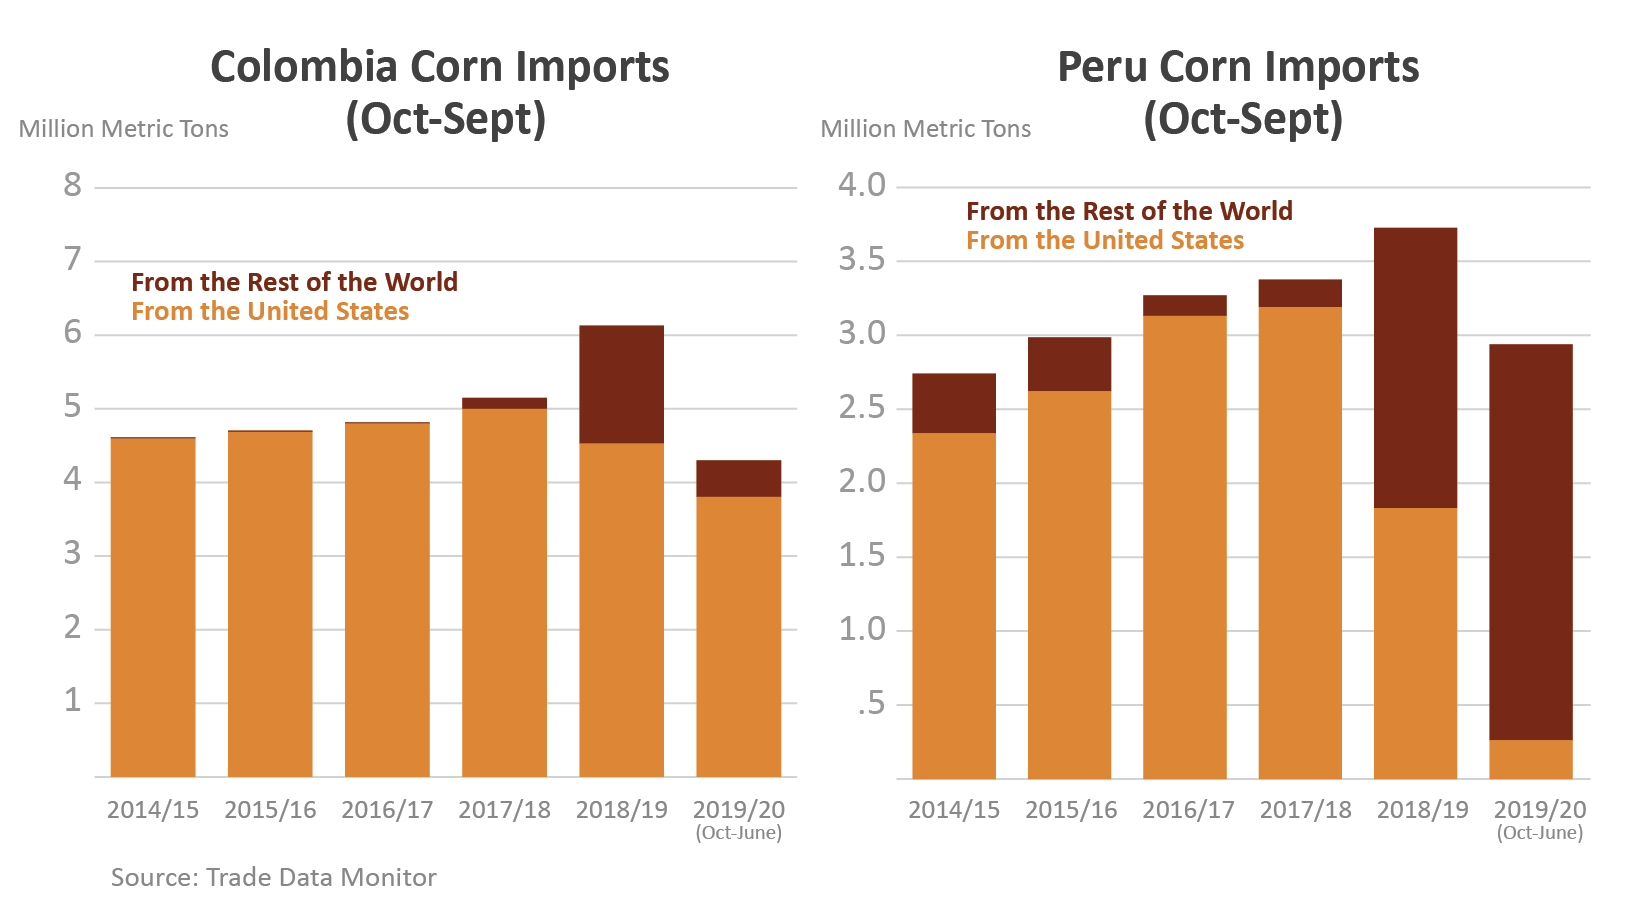
U.S. prices hit a 5-year high in the spring of 2019, caused by unprecedented planting delays due to wet weather. Uncertainty over the crop size kept prices elevated into the summer, eroding the competitiveness of U.S. corn in foreign markets. Flooding of the Mississippi River added logistical challenges and limited barge traffic to the Gulf terminals. Concerns over quality in the 2019 crop (i.e., low test weight and broken/damaged kernels) may have also contributed to smaller exports. Colombia and Peru turned to Argentina, which had been their major supplier of the past, while Mexico also sought to diversify suppliers.

Colombia and Peru: Key Markets in South America
Under the U.S-Colombia Trade Promotion Agreement, U.S. corn is subject to tariff-rate quotas (TRQs). Combined quotas for yellow and white corn are 3.3 million tons for 2020. Within the quotas, U.S. corn is duty free. Over the quotas, U.S. corn is subject to a tariff that declines annually to reach zero in 20232. Corn from other origins (i.e. MERCOSUR) is subject to a 25-percent duty plus a variable levy under the price band system when imports are priced lower than domestic corn. U.S. corn is exempted from the price band.
As the TRQs are managed on a first-come, first-served basis, importers have returned to U.S. corn and already filled the quotas in the first six months of 2020. Colombia depends on corn imports as local production remains small. Local production supplies only about 20 percent of annual consumption. Imports are driven by growing demand for feed in poultry and swine production. In recent years, food demand has grown relatively faster reflecting an influx of immigrants from Venezuela.

The corn-related provisions of the U.S.-Peru Trade Promotion Agreement were fully phased in on January 1, 2020, and U.S. corn now enters Peru duty free and quota free. Peru assesses no duty on corn imports from non-U.S. origins, but they are subject to a variable levy under Peru’s price band system when imports are priced lower than domestic corn.
Peru’s countervailing duty (CVD) investigation on U.S. corn during 2018–2019 partly coincided with a period of strong U.S. prices and led to a reduced U.S. market share. While the CVD threat ended in January 2020 without resulting in a punitive tariff, a lower variable levy has boosted the competitiveness of non-U.S. corn3. Peru depends on imports because its production accounts for barely a third of annual consumption. Locally grown corn is mostly used in the food industry, while imports are used to satisfy feed demand from Peru’s expanding poultry sector.
Mexico: Top Destination for U.S. Corn

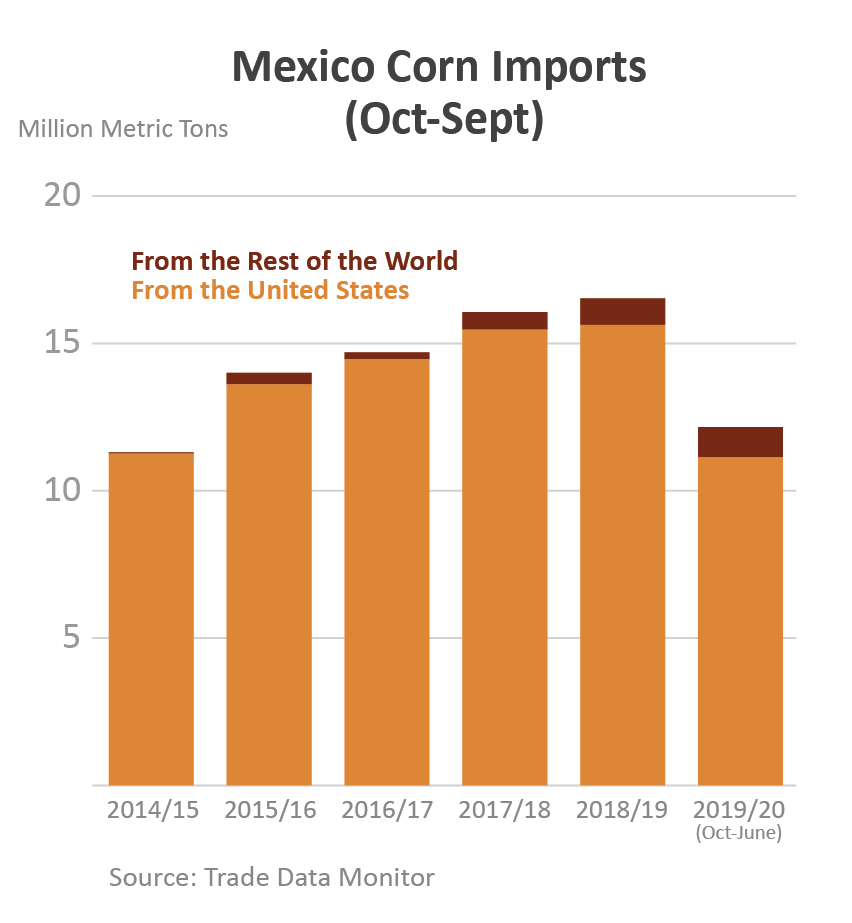
Mexico is the top destination for U.S. yellow corn, which is primarily used for animal feed. Locally produced white corn is mostly used for food. Infrastructure developed since the North America Free Trade Agreement has greatly enhanced the competitiveness of U.S. corn over its South American suppliers. U.S. corn has entered Mexico duty free since 2008 and that will continue under the United States-Mexico-Canada Agreement.
About 60 percent of U.S. corn enters by truck and rail, while shipments from South America travel longer distances by water and, upon arrival, incur further costs to travel inland. With transportation advantages, the United States has supplied essentially all of Mexico’s import needs. While Mexico makes occasional efforts to diversify its suppliers, market forces limit the practicality of that approach.
U.S. Export Prospects Bright
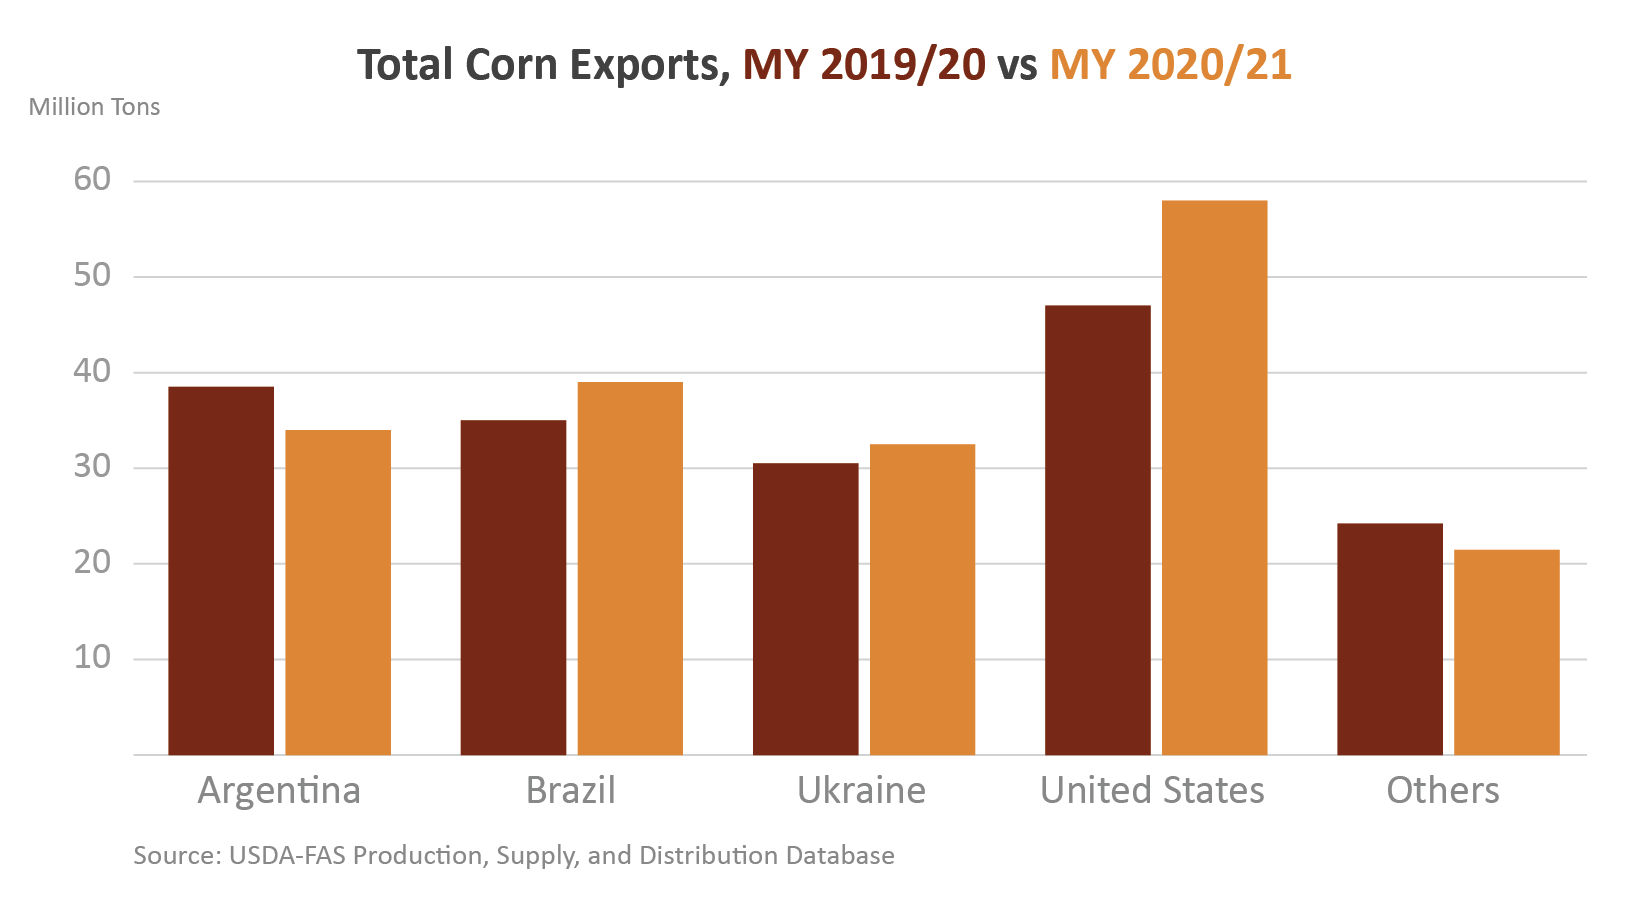
Moving into 2020/21, the United States is currently forecast to have the second-largest corn crop on record, and exports are forecast up 23 percent (about 11 million tons) from a year ago. U.S. corn is expected to be competitive due to large available supplies and reduced competition from other exporters, namely Argentina, Brazil, and Ukraine.
The export growth in those countries is forecast to be limited due to smaller available supplies (Argentina and Ukraine) and strong domestic prices (Brazil). For Brazil, strong demand for meat exports to China has stimulated expansion in beef, pork, and chicken production. This development is expected to boost demand for corn in Brazil’s domestic market and to moderate the volume available for export.
With preferential terms and less expected competition, U.S. corn should be able to regain market share in Latin America in the coming year.

1 All countries in the Western Hemisphere except Canada, the United States, Brazil, and Argentina
2 The U.S.-Colombia Trade Promotion Agreement established TRQs. The quotas grow 5 percent annually over the 12-year tariff phase-out period, which ends in 2023. The 2020 TRQ for yellow corn is 3,102,656 tons with the over-quota import duty at 6.3 percent; for white corn at 201,673 tons with the over-quota import duty at 5.0 percent.
3 On January 17, 2020, the National Institute for the Defense of Free Competition and the Protection of Intellectual Property (INDECOPI) ruled not to impose a CVD. The variable levy has ranged from $0 to $21 per ton in 2020 and has been only $4 per ton since August.
