Processed Product Spotlight: Growth in Exports of U.S. Potato Products
Contact:
Printer-Friendly PDF (124.27 KB)
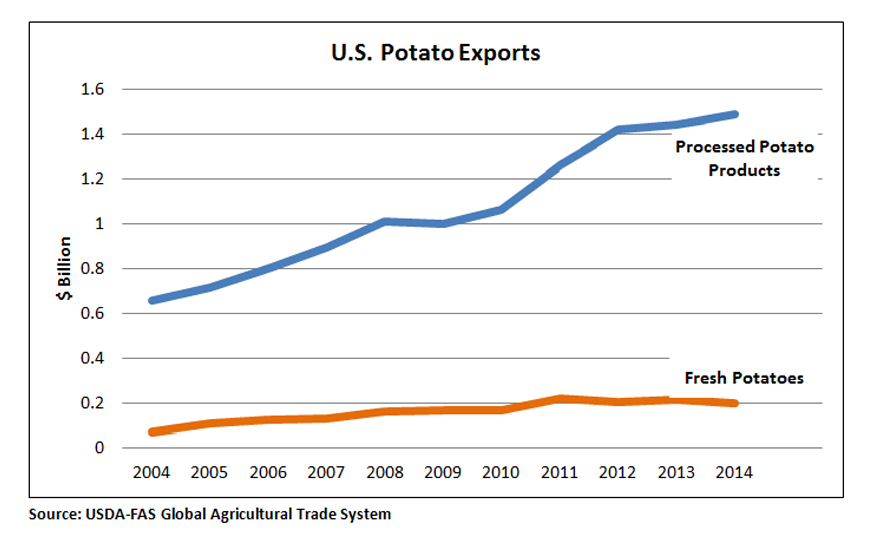
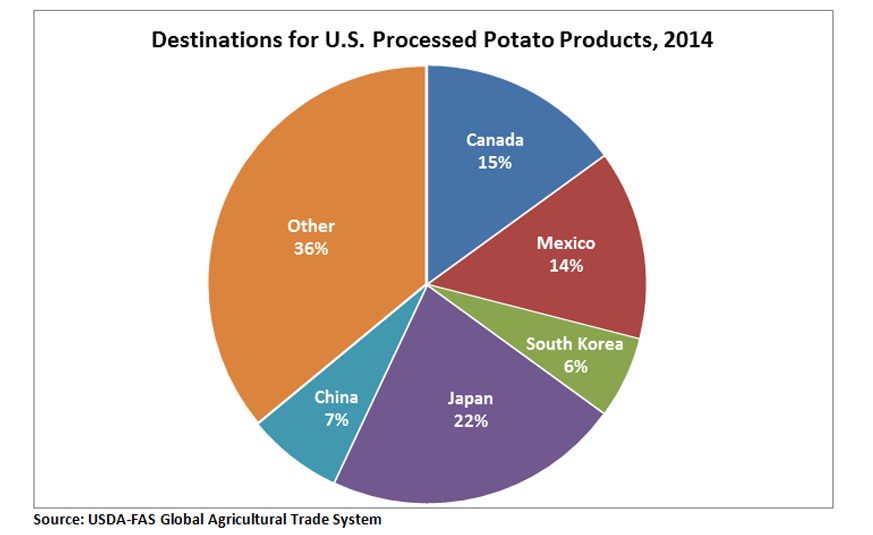
The United States is the world’s top exporter of processed potato products. Over the past decade those exports have grown 127 percent, reaching a record $1.5 billion in 2014 and far outpacing growth in U.S. exports of fresh potatoes. Export markets for U.S. potato products have become more diversified in recent years, and sales have been especially strong to new Asian markets. Japan was the top export top destination in 2014, followed by Canada, Mexico, China, and South Korea.

French Fries Dominate U.S. Potato Product Exports
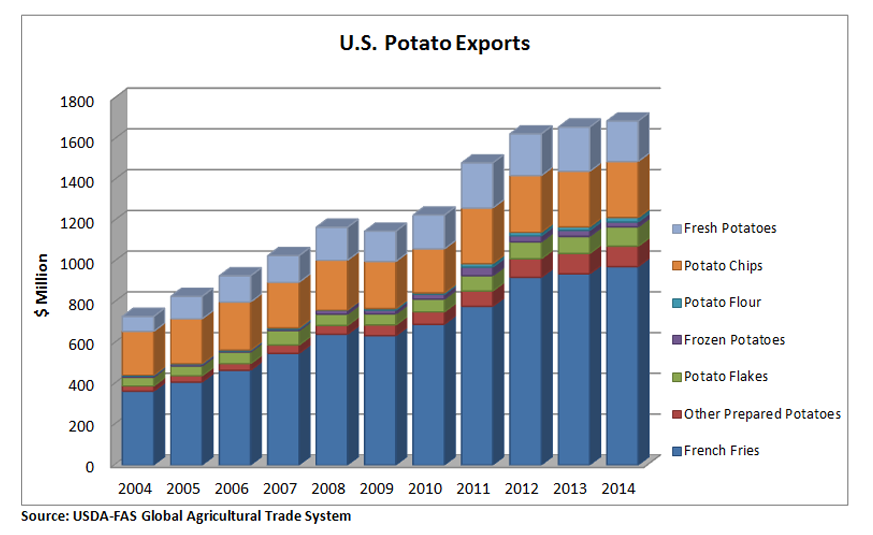
Total U.S. potato exports, including fresh and processed potatoes, reached a record level of nearly $1.7 billion in 2014. Among processed products, French fries accounted for two-thirds of U.S. exports. Exports of French fries have increased 54 percent since 2009, reaching a record $975 million in 2014. Japan was the top destination, buying about a quarter of U.S. exports.
Potato chips were the second-largest processed potato product exported, totaling $275 million in 2014. Canada was the largest market, buying about half of U.S. exports, followed by Mexico with 15 percent. Growth in potato chip exports has been the slowest among potato products. Other key products exported are potato flakes (valued at $95 million in 2014), frozen potatoes ($25 million), and potato flour ($21 million).
U.S. fresh potato exports have continued to lag, falling by 8 percent in 2014. The top destination for fresh potatoes was Canada.

U.S. Potato Exports
| Product | 2009 | 2014 | Increase |
| French Fries | $635 million | $975 million | +54% |
| Prepared Potatoes (excluding French Fries) | $53 million | $100 million | +89% |
| Potato Flakes | $55 million | $95 million | +73% |
| Frozen Potatoes | $18 million | $25 million | +39% |
| Potato Flour | $8 million | $21 million | +163% |
| Potato Chips | $231 million | $275 million | +19% |
| Total Processed Potato Products | $1000 million | $1490 million | +50% |
| Fresh Potatoes | $149 million | $199 million | +34% |
| Total Potato Exports | $1150 million | $1690 million | +55% |
U.S. Potato Export Markets Diversify
Historically, the top three markets for U.S. processed potato products have been Japan, Canada and Mexico. Canada has been a stable market, but has seen a slight decline in imports from the United States since 2011, dropping from $227 million to $216 million in 2014. U.S. exports to Mexico, however, have been increasing rapidly, up 42 percent since 2009 to $205 million.

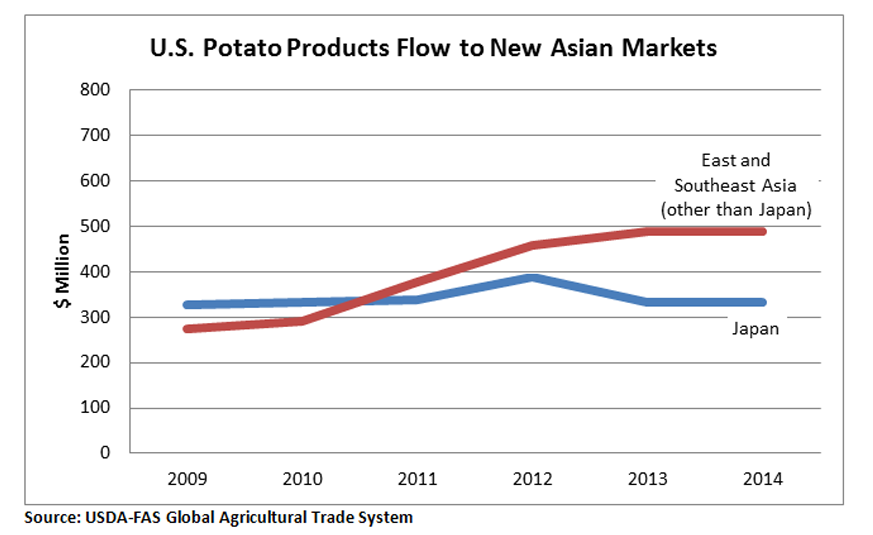
Sales to Asia have been responsible for the majority of total growth in U.S. processed potato exports in recent years. Although exports to the United States’ top customer, Japan, have remained mostly flat, shipments to a range of other markets have soared. Seven of the top 10 U.S. markets in 2014 were in East and Southeast Asia, including China (where exports have tripled over the past five years), South Korea, Philippines, Taiwan, Malaysia, Singapore, and Hong Kong.

