
Opportunities for U.S. Ingredient Exports to Brazil
Contact:
Link to report:
Executive Summary
Brazil is the fourth-largest export destination for U.S. agricultural and processed products in South America and depends on international suppliers to meet its demand for food processing ingredients, especially specialty products with high added value. These products offer significant opportunities for U.S. companies to supply Brazilian food manufacturers looking to meet the needs of a growing health-conscious consumer market. Whey, milk albumin, casein, alternative proteins, flavorings, vegetable fats (including oils), and frozen fruits may hold particularly attractive growth potential for U.S. exporters.
Macroeconomic Perspective
Brazil is the most populous nation in Latin America with nearly 214 million people. It is the third-largest economy in the Western Hemisphere and the 12th largest in the world with a gross domestic product (GDP) of $1.6 trillion in 2021.1 Even though the country has experienced high inflation and slow post-pandemic labor market growth, Brazil still managed a per capita GDP increase of 10 percent during 2020, to $7500.
While the United States and Brazil compete for global market share in several major international agricultural exports, there remain significant opportunities for bilateral trade. Intermediate goods (excluding non-beverage ethanol) comprised 47 percent of the $734 million of U.S. agricultural exports to Brazil in 2021. Nearly $200 million of U.S. exports were classified as processed products,2 making the United States the seventh-largest supplier of processed products to Brazil.
Food Ingredient Trends and Opportunities
Brazil’s food processing sector increased by 17 percent to $171 billion in 2021,3 correlating with increased imports of food processing ingredients to fulfill demand. Brazilian manufacturers are increasingly looking for high added value ingredients to meet the growing demand for specialty health foods. These types of products present good opportunities for U.S. companies looking to export whey, milk albumens, caseins, alternative proteins, flavorings, vegetable fats (including oils), and frozen fruits.
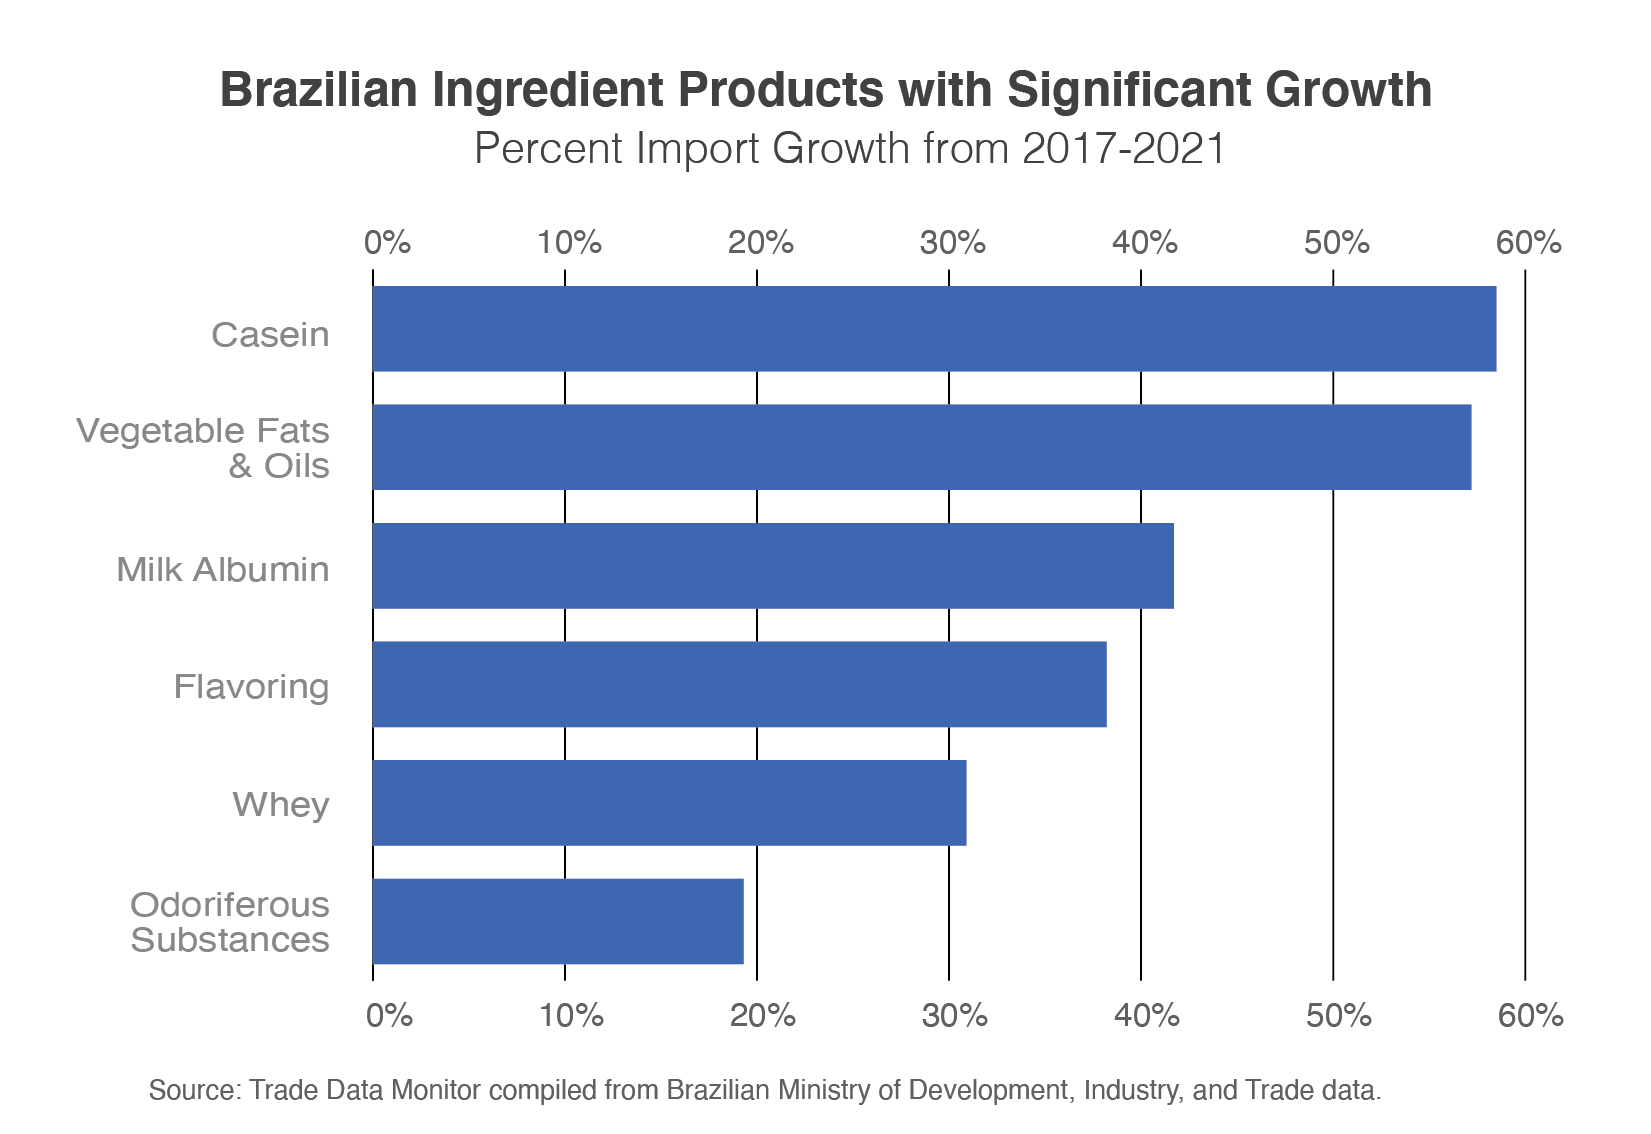
Ingredient Products with Significant Trade Potential
| Product | Brazil Total Imports 2021 |
5 Yr. Growth | Imports from U.S. 2021 |
Market Share |
| Whey | 50.2 million | 31% | 9.7 million | 19% |
| Milk albumin, including concentrates of two or more whey proteins | 55.2 million | 42% | 19.0 million | 34% |
| Casein, caseinates, and derivatives | 43.7 million | 58% | 1.0 million | 2% |
| Odoriferous substances for food and beverages | 89.3 million | 19% | 40.4 million | 45% |
| Flavoring from vegetable saps and extracts, including hops and licorice | 84.3 million | 38% | 27.5 million | 33% |
| Vegetable fats & oils | 1.4 billion | 57% | 4.5 million | 0.3% |
Source: Trade Data Monitor compiled from Brazilian Ministry of Development, Industry, and Trade data.
Dairy Ingredients (Whey, Albumin, Casein)
Brazil imported $149 million of whey, milk albumin, and casein products from all suppliers in 2021, up from $89 million in 2017. The United States held a combined market share of 20 percent among the three products, amounting to $30 million in 2021. Both whey and milk albumin concentrates are commonly used in the production of health foods aimed at increased protein consumption such as protein bars, shakes, snacks, and powders. While the United States maintained significant market share in both ingredients, Argentina is the leading supplier to Brazil in both whey (47-percent share) and milk albumin (38-percent share). Argentina has preferential access to the Brazilian market as members of the Mercosur customs union, which also includes Uruguay and Paraguay. However, U.S. dairy ingredient exports of whey and albumin still retain a competitive advantage in terms of quality and availability. Casein is a primary ingredient in baby formula, currently the best performing retail category in 2022, with retail value sales rising by 14 percent following the return of mothers to the post-pandemic workplace.3 The United States remains a relatively minor supplier of casein products compared to the European Union (EU) (62-percent share) and New Zealand (25-percent share).
Alternative Proteins
Proteins originating from pea, soy, rice, and others have become increasingly popular alternatives to animal protein sources for customers looking to reduce their environmental footprint and/or seeking specific health benefits. These ingredients are commonly used in plant-based product formulations to supplement protein consumption. During 2021, Brazil imported $48 million of protein concentrates and isolates. The United States was the leading supplier with 35-percent market share, $17 million, followed closely by the People’s Republic of China (PRC), which also held a 35-percent share. Approximately 17 percent of U.S. protein concentrate and isolate exports were derived from soy and 21 percent from other protein alternatives.
Flavor Enhancers (Vegetable Saps, Extracts, Odoriferous Substances)
In 2021, Brazil imported $174 million of flavor-enhancing ingredients—including vegetable saps, extracts, and odoriferous substances which are also used to add flavor or color to food products and beverages—a 28-percent increase from $136 million in 2017. The United States is the largest supplier of both categories with 40 percent of market share ($70 million in combined products). More than $40 million of U.S. flavor-enhancing products were odoriferous substances, and $22 million were vegetable saps and extracts of hops, which are widely used by large breweries in Brazil. In 2021, total Brazilian beer sales increased by 8 percent and are forecast to grow at an annual compounded rate of 4 percent to 18 billion liters by 2026.5
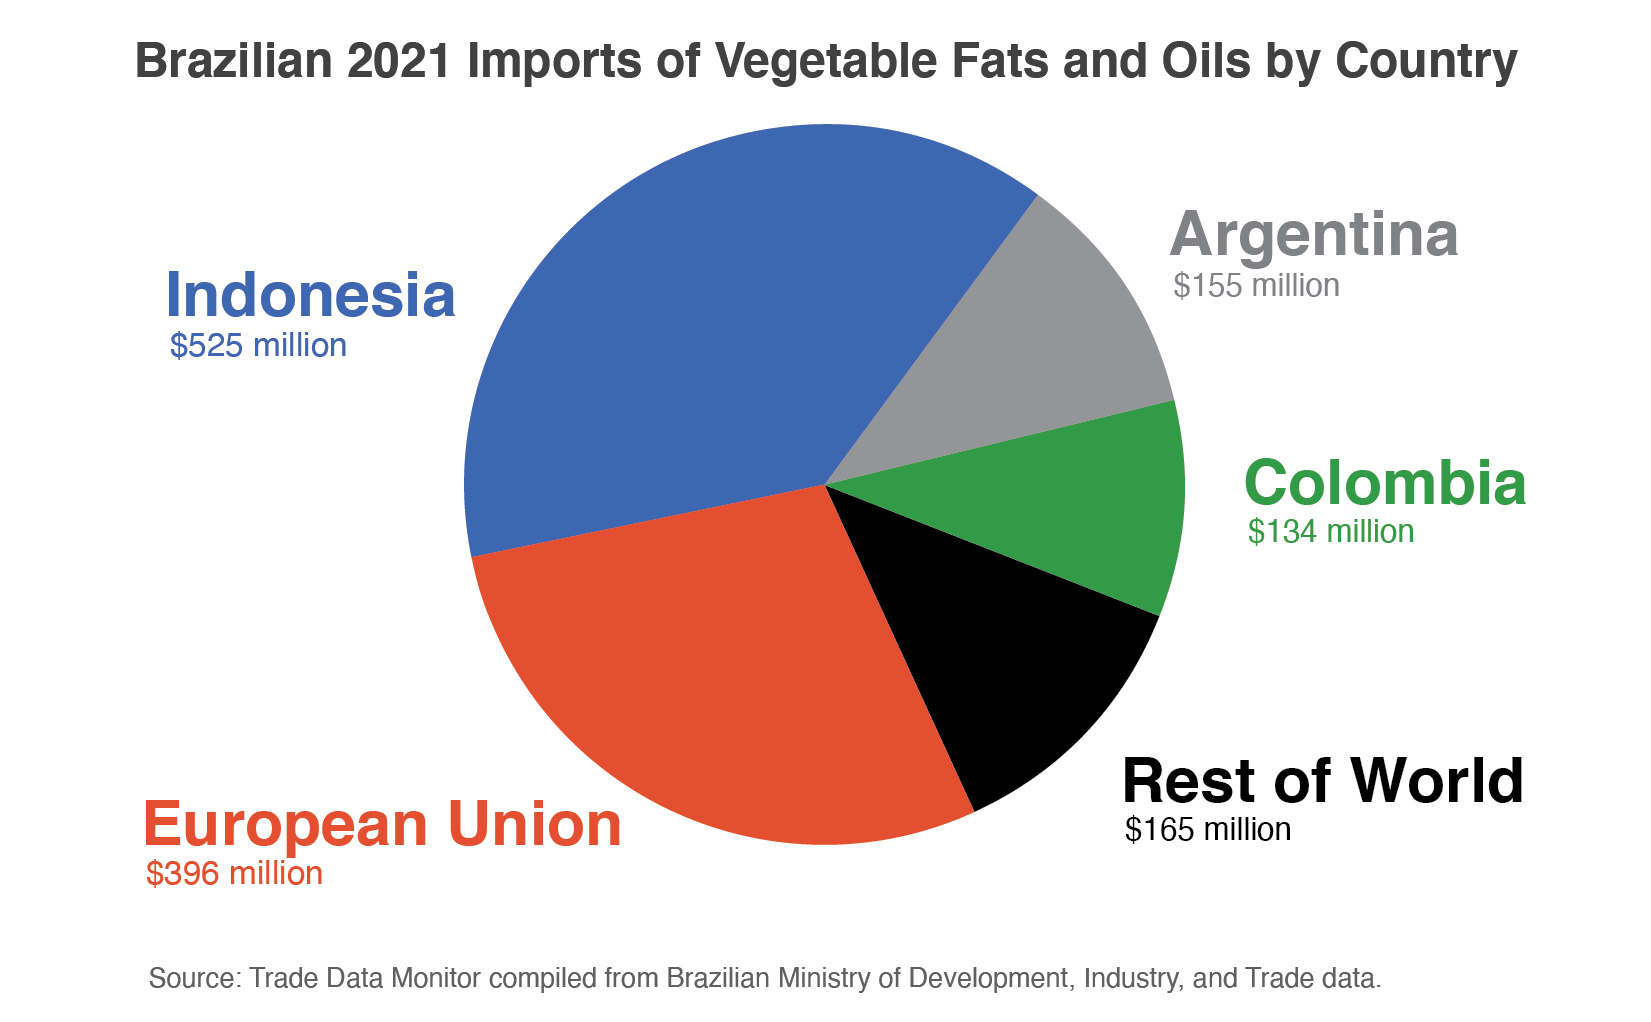
Vegetable Fats and Oils
The Brazilian import market for vegetable fats and oils was nearly $1.4 billion in 2021. Eighty percent of these imports were unrefined Indonesian and Colombian palm oil, Portuguese olive oil, and Argentinian soybean and sunflower oil. The United States holds a smaller, but differentiated, market share with a mixture of $4.5 million worth of refined coconut, sesame, rapeseed, peanut, corn, and cottonseed oil products. Vegetable fat and oil imports from the United States increased by 23 percent since 2017, while the total Brazilian vegetable fat and oil import market grew at a combined rate of 57 percent during the last 5 years. While soybean oil is expected to remain a staple in Brazilian households, olive oil and other specialty oils including coconut and sesame oil are the fastest growing vegetable fat ingredients in the Brazilian retail sector. Retail sales of olive oil increased by 15 percent in 2021 as consumers diversified away from traditional products due increased soy prices and combined edible oil retail sales are forecast to grow at a compound annual rate of 9 percent during the next 4 years.6
Frozen Fruits
Despite producing robust volumes of fresh fruit, Brazil still imported $18 million worth of frozen fruit in 2021, largely as food processing ingredients. Chile and PRC are Brazil’s largest suppliers of frozen strawberries and raspberries, while imports of various Israeli frozen fruit products gained significant market share in 2021. Brazilian imports from the United States are a combination of raspberries, blueberries, cherries, blackberries, mulberries, loganberries, currents, gooseberries, and other frozen fruits. While Brazilian imports of frozen fruit from the United States have been limited, shelf stability has driven increased demand in recent years. Imported frozen and processed fruit products fill demand for variety, are more easily transported, and provide alternatives to local produce.
Trade Policy
Brazil has made several changes to its agricultural policies in 2022, including proposed regulations regarding biopesticides, updated product registration procedures, and temporary tariff cuts for select import categories to fight inflation. In February 2022, a protocol to the 2011 U.S.-Brazil Trade Agreement went into effect, adding new commitments on trade facilitation, regulatory practices, and anti-corruption. The Office of the United States Trade Representative’s summary fact sheet of the changes can be found here. Mercosur is also in the process of negotiating a trade agreement with the EU, which if ratified, could impact the competitiveness of some commodities covered in this report. The Brazilian National Agency of Sanitary Surveillance and the Ministry of Agriculture Livestock and Food Supply (ensure the safety of the imported agricultural goods and enforce regulations related to food and beverage products. For detailed information on import-related policy and procedures, see the 2021 Food and Agricultural Import Regulations and Standards (FAIRS): Brazil Country Report. An updated FAIRS report will be available on the the U.S. Department of Agriculture’s Foreign Agricultural Service (FAS) Global Agriculture Information Network website at the end of 2022. For information on food processing ingredient market conditions, see the FAS Agricultural Trade Office’s most recent Brazil: Food Processing Ingredients report.
1 World Bank, GDP calculated in current USD
2 Global Agricultural Trade System (GATS)
3 Brazilian Food Processors' Association (ABIA)
4 Euromonitor International, September 2022 Baby Food in Brazil report
5 Euromonitor International, July 2022 Beer in Brazil report
6 Euromonitor International, December 2021 Edible Oils in Brazil report