
New Opportunities Arise in the Netherlands Post-Pandemic
Contact:
Link to report:
Executive Summary
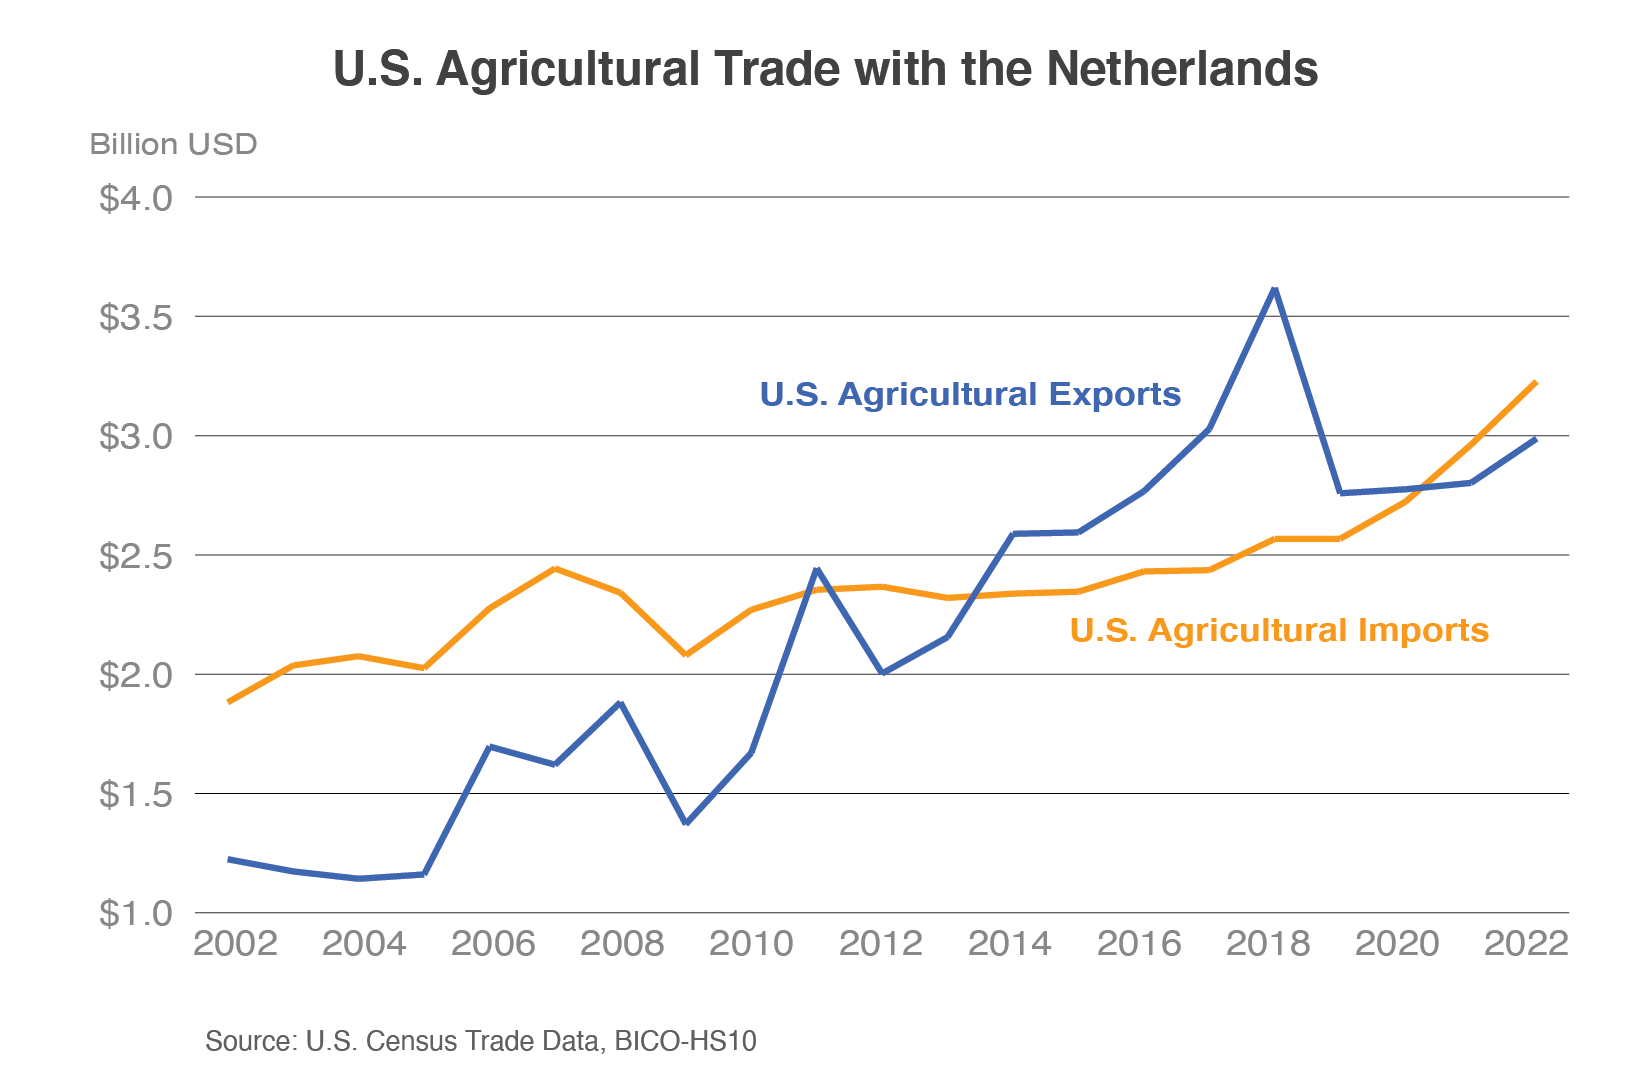
Since the Netherlands lifted all COVID-19 related restrictions at the end of February 2022 and most people returned to the workplace, new opportunities continue to emerge for U.S. agricultural products. Consumers are especially interested in healthier, more convenient, nutritious, and high-quality products. According to the November 2022 Euromonitor report on staple foods in the Netherlands, Dutch consumers have been spending less time at home and more time eating out at restaurants and bars. However, during the last few months in 2023, consumers are also shifting to cheaper food options, private labels, and shopping between different supermarkets. The Netherlands has one of the largest ports in Europe and is home to a population of 17.8 million people. In 2022, the United States exported $3.0 billion of agricultural products1 to the Netherlands. Products that have high potential in the Dutch marketplace are mostly consumer-oriented products, including alcoholic and non-alcoholic beverages, condiments and sauces, and snacks.
Consumer-Oriented Products Have Better Potential to Expand in the Netherlands
Table 1: Top U.S. Agricultural Exports to the Netherlands (Value in Million U.S. dollars)
| 2018 | 2019 | 2020 | 2021 | 2022 | |
| Tree Nuts | $415 | $458 | $386 | $407 | $440 |
| Soybeans | $1,271 | $479 | $550 | $372 | $373 |
| Ethanol (non-bev.) | $107 | $75 | $185 | $97 | $252 |
| Beef and Beef Products | $126 | $120 | $120 | $124 | $185 |
| Dextrins, Peptones, and Proteins | $135 | $152 | $161 | $177 | $171 |
| Food Preparations | $189 | $216 | $226 | $248 | $168 |
| Distilled Spirits | $55 | $51 | $57 | $121 | $168 |
| Essential Oils | $157 | $183 | $179 | $208 | $155 |
| Vegetable Oils (excl. soybean) | $110 | $100 | $112 | $132 | $121 |
| Planting Seeds | $121 | $131 | $115 | $110 | $83 |
| All Other Agricultural Exports | $933 | $792 | $683 | $804 | $872 |
| Total U.S. Agricultural Exports | $3,619 | $2,758 | $2,775 | $2,802 | $2,987 |
Note: Column totals may not add up exactly due to rounding.
Source: U.S. Census Trade Data, BICO-HS10
As shown in Table 1, the top U.S. agricultural products include mostly consumer-oriented products, such as packaged foodstuffs sold in supermarkets, and some bulk and intermediate products. Dutch food processing companies use bulk and intermediate products as ingredients for end-use products to be sold in other consumer markets. According to the U.S. Department of Agriculture’s Foreign Agricultural Service (FAS) Exporter Guide for the Netherlands, more than 7,430 food companies in the Netherlands generated net sales of $88 billion in 2021 (Netherlands Exporter Guide). Additionally, the Dutch retail sector employs nearly 300,000 people and operates 4,600 stores. Hotel, restaurant, and institutional (HRI) food service companies that offer convenient online ordering with pick-up or home delivery options have performed well since the pandemic. The following U.S. agricultural products have high potential to expand in the Dutch market: 1) alcoholic (craft beer, wine, and distilled spirits) and non-alcoholic beverages, 2) certain beef and beef products, 3) condiments and sauces, and 4) soybeans.
Alcoholic and Non-Alcoholic Beverages: Prospects for alcoholic and non-alcoholic beverages have never been better in the Dutch market. According to the 2022 Euromonitor reports on alcoholic drinks, overall domestic and foreign retail sales have increased in the Netherlands. As restaurants and bars reopen after lockdown measures, more sales are expected to shift from off-trade to on-trade channels2. In 2022, Dutch imports totaled $535 million for beer, $1.6 billion for wine, $1.4 billion for distilled spirits, and $1.2 billion for non-alcoholic beverages. While other European Union (EU) member states were the top suppliers across all drink categories, the United Kingdom (UK) was the leading non-EU supplier for distilled spirits, followed by the United States and Chile. For wine and related products, Chile was the leading non-EU supplier with South Africa and Australia trailing behind. The UK and Mexico were the leading non-EU suppliers for beer, while the United States was the leading non-EU supplier of non-alcoholic beverages.
Demand for craft beer has been rising. According to the FAS Exporter Guide, Dutch consumers are looking for new flavors, interesting labels, and innovative tastes. In restaurants, specialty craft beer increasingly replaces wine when pairing with food. As shown in Table 2, the number of craft breweries in the Netherlands has been increasing and nearly doubled since 2016. Craft breweries in the Netherlands continue to experiment with new beers and beer styles. Additionally, U.S. breweries are gaining popularity in the Dutch market (NL2021-003 Overview of the Dutch Beer Market).
Table 2: Number of Craft Breweries in the Netherlands
| 2016 | 2017 | 2018 | 2019 | 2020 | 2021 | |
| Total number of breweries | 499 | 623 | 740 | 782 | 871 | 903 |
| Number of which are craft breweries | 419 | 519 | 605 | 622 | 711 | 733 |
Source: Euromonitor International
The Dutch market remains a strong market for wine. Since the availability of domestically produced wine is limited, the Dutch depend on imports. U.S. wine exporters face stiff competition from France, Italy, Germany, and Spain, as well as Australia, South Africa, and Argentina. Regarding distilled spirits, sales had been impaired by COVID-19 lockdown measures. Nevertheless, consumers are interested in branded, good-quality, tasty, and unique products that have a story to tell. According to Euromonitor, demand for rum, vodka, and whiskey is expected to recover as clubs and late-night bars reopen and operate with more normalized hours. Demand for non-alcoholic drinks has been growing due to health concerns. According to Eurostat, mineral waters and non-alcoholic beers made up most of the non-alcoholic beverage imports. Dutch non-alcoholic beer imports increased from $10 million in 2018 to $27 million in 2022. For other beverage types, there is potential for products with a special certification, innovative packaging, and new tastes.
Condiments and Sauces: In 2022, the Netherlands imported $681 million of condiments and sauces, up 2 percent from the previous year. The main suppliers were other EU member states, Thailand, China, and the United States. Euromonitor reported growth in retail sales of sauces, dressings, and condiments in terms of value in 2022, after a slow performance the year before due to inflationary pressures. According to Euromonitor, Dutch consumers have been interested in authentic ethnic cuisine and sauces including chili, fish, and oyster sauces. There is also an increasing trend towards low-fat, low-salt, gluten-free, sugar-free, and organic sauces. Additionally, Dutch manufacturers are keen to take advantage of burgeoning consumer interest in barbecue sauces. For example, the Dutch producer Remia developed three new variants of barbecue sauce in 2022.
Beef and Beef Products: In 2022, the Netherlands imported $2.7 billion of beef and beef products. The top beef suppliers were other EU member states, Argentina, and Uruguay. More recently, the Netherlands is increasing its import quota to 55,000 metric tons during the next 7 years. According to the FAS Exporter Guide for the Netherlands, the Dutch supply of high-quality beef is limited. The United States was the fifth-largest supplier, but it has an advantage, exporting high-quality, grain-fed beef. U.S. beef is known for its consistency and taste, and demand is strong from high-end HRI industries and certain retail outlets. Beef from hormone-treated cattle cannot be exported to the Netherlands.
Soybeans: In 2022, the Netherlands imported $2.4 billion of soybean products, up 10 percent from the previous year. The top suppliers of soybeans were the United States, Brazil, and Uruguay. While soybean production in the EU is expected to rise in marketing year 2022/2023, the EU will still rely on imported soybeans to meet demand (FAS GAIN Report). The EU experienced drought and hot weather during the summer of 2022. Additionally, EU crop production has been impacted by Russia’s invasion of Ukraine; prices of feed and food have been increasing.
Seafood and Forestry Products Also Have Potential to Expand in the Netherlands
In addition to consumer-oriented products, agricultural-related products like U.S. seafood products and wood pellets have prospects for growth in the Netherlands. The Netherlands is one of the top importers of seafood products in Europe. Dutch seafood imports reached $5.6 billion in 2022. The largest suppliers of seafood products are Iceland, Norway, and other EU member states. The United States is the 11th-largest non-EU supplier of seafood in 2022. Frozen Alaskan pollock represented about half of U.S. seafood exports to the Netherlands (FAS GAIN Report). The top growth segments for U.S. seafood exports are seafood processing, followed by the HRI-foodservice sector. Due to the strong dependence of seafood processing companies on seafood from outside the EU, there continue to be opportunities for U.S. exporters of seafood products to grow their market share in the Netherlands. With restaurants opening their doors once again after COVID-19, there will potentially be increased demand for high-quality and sustainable certified fishery products such as lobsters, oysters, and scallops from the United States. However, sales could be tempered as the cost of living has increased and Dutch consumers are carefully watching their spending on food. U.S. exporters that have a story to tell about their seafood could have a competitive advantage, especially if their products highlight respective health benefits, freshness, and/or versatility. At the retail level, there is demand for tasty, sustainable products in small consumer packaging. Product information, suggested recipes, and preparation tips can persuade consumers to buy certain fish and make them feel good about their purchase. According to a study by the European Market Observatory for Fisheries and Aquaculture Products, Dutch per capita consumption is estimated at almost 21 kilograms per year. The most popular fish products were salmon, followed by tuna, herring, and fish fingers.
Biomass wood pellets continue to remain strong in the Dutch market. The Netherlands is the second-largest destination for U.S. wood pellets, just behind the UK. U.S. exports of wood pellets climbed to $273 million in 2022, up 47 percent from the previous year. Most wood pellet products are used for Dutch power plants and co-fired with coal (FAS GAIN Report). The top suppliers are the United States, other EU member states, Russia, and Brazil. On December 15, 2021, the Dutch government originally expressed goals to phase out wood pellet use for energy purposes and only source biomass wood products produced in the EU to monitor compliance and sustainability. However, as of April 22, 2022, the Dutch government supports biomass products for high value purposes (e.g., biochemicals, plastics, and materials replacing fossil feedstock), applications which have no renewable alternative, and applications by which carbon is stored. Also, the Dutch government will not restrict biomass sources to only the EU because such a policy must be made at the EU level.
Demographics and Macroeconomic Considerations
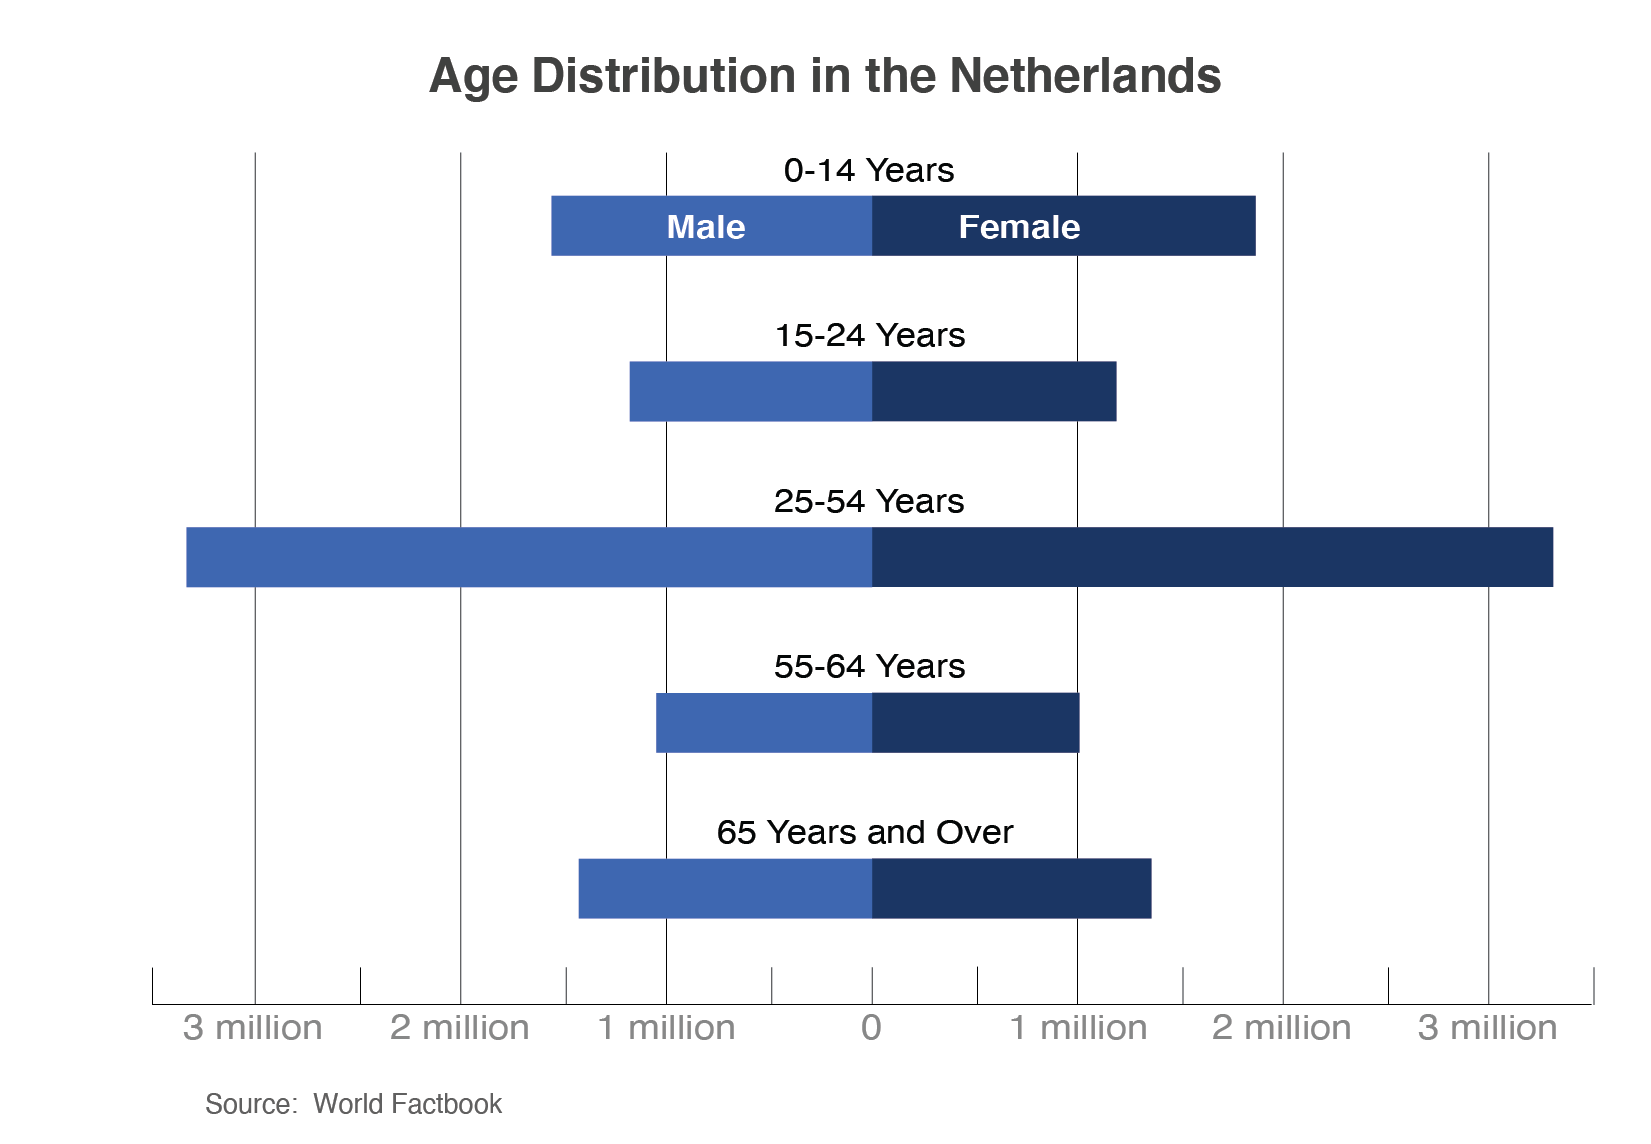
The Netherlands is a high-income country in Europe and core member of the EU. According to the World Factbook, the Netherlands has a population of 17.8 million people as of January 2023, and their median age is 42.8 years, compared to 38.5 years for the United States. The Randstad, an unofficial name for the area made up of Amsterdam, Rotterdam, the Hague, and Utrecht, is the most densely populated region in the Netherlands. About 93 percent of the total Dutch population is in urban areas.
According to S&P Global, the Dutch economy avoided a recession in the fourth quarter of 2022. The economy grew 0.6 percent quarter-to-quarter on strong exports and household consumption. In 2022, the Dutch economy expanded by 4.5 percent overall. However, S&P Global projected economic growth to slow down throughout 2023 due to the lagged effect of higher interest rates on private consumption and investments. Additionally, S&P Global forecasts real gross domestic product growth at 1.0 percent for 2023 and 1.1 percent for 2024, and their annual inflation rate to average 3.9 percent in 2023 before rising to 4.2 percent in 2024. Further, inflation will be a factor in determining future economic output. Although the energy price cap will keep energy prices low, prices for food and other goods and services will remain high, due to firms and companies passing higher energy costs and wages on to sale prices for their goods.
Conclusion
With the reopening of the Dutch economy from strict COVID-19 lockdowns and more people going back to the workplace, the Netherlands will remain a strong destination for U.S. agricultural products. U.S. consumer-oriented products have a good reputation among Dutch consumers who prefer to purchase healthy, convenient, and high-quality products. Products exported to the Netherlands should be free from pesticides subject to maximum residue limit testing. Additionally, U.S. beef from hormone-treated cattle, poultry, live bivalve mollusks (except for those from approved establishments in Massachusetts and Washington state), and products containing genetically modified organism-derived ingredients that are not EU-approved cannot be exported to the Netherlands. U.S. exporters should take caution regarding the current economic situation in 2023, which is affected by Russia’s invasion of Ukraine, inflation, and high energy prices. These factors can influence consumer trends in the Dutch market.
1 Does not include agricultural related exports: seafood, forest, and biodiesel products.
2 Off-trade refer to sales of alcoholic drinks through retailers and stores while on-trade are sales made by on-premises sites including restaurants and bars.