U.S. Agricultural Exports to Central America’s Northern Triangle Prosper Under CAFTA‐DR

  |   International Agricultural Trade Report

Contact:

Printer-Friendly PDF

Central America’s Northern Triangle – which includes El Salvador, Guatemala, and Honduras – offers significant market opportunities for exporters of U.S. farm and food products. As the region continues to experience both population and economic growth, demand for imported goods – particularly high‐value, consumer‐oriented food products – is on the rise.

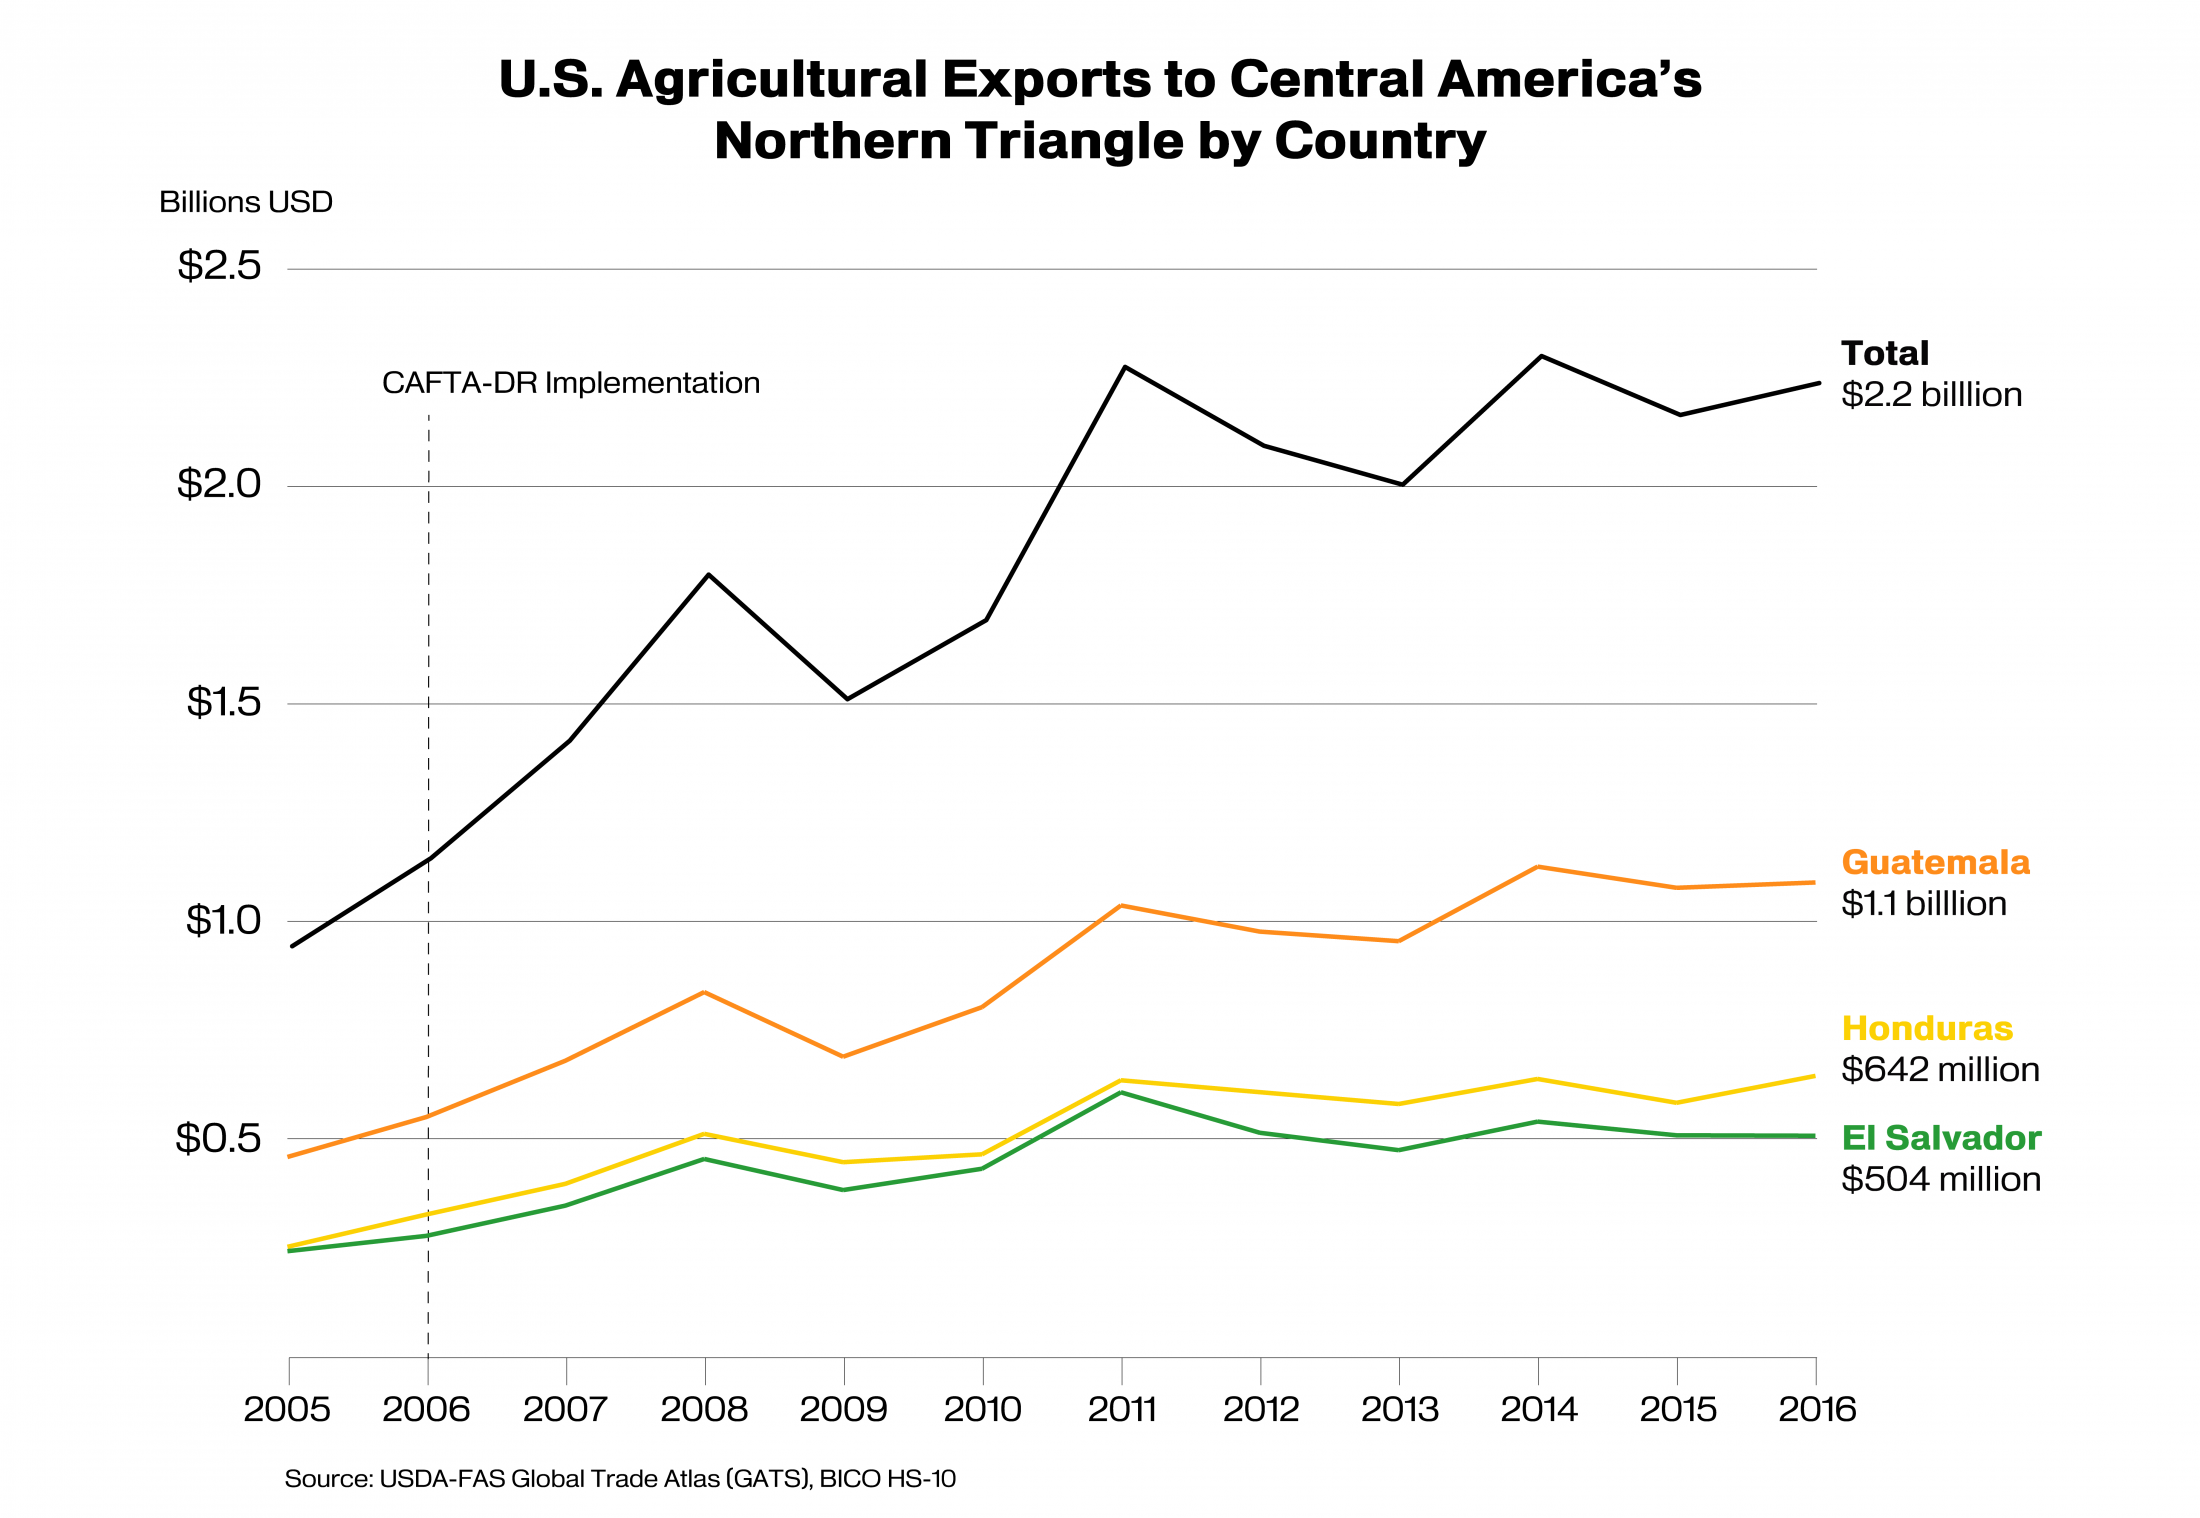
CAFTA‐DR – the United States’ free trade agreement with Costa Rica, the Dominican Republic, El Salvador, Guatemala, Honduras, and Nicaragua – has strengthened U.S. ties with Central America and helped spur economic growth, trade, employment, and expansion of the region’s middle class. Since implementation of the agreement began in 2006, U.S. farm and food exports to the CAFTA‐DR countries have doubled, reaching $4.3 billion in 2016. Exports to the three Northern Triangle countries have seen the fastest growth, doubling from $1.1 billion in 2006 to $2.2 billion in 2016.
Line graph showing U.S. exports to Central America's Northern Triangle by country. Exports totaled $2.2 billion in 2016.

The Northern Triangle countries have a collective real gross domestic product (GDP) of nearly $225 billion.i  Guatemala, the most populous, has the largest GDP at $135.9 billion, followed by El Salvador with $49.7 billion, and Honduras with $39.2 billion. Agricultural exports play a significant role in the economic stability of the Northern Triangle, with much of the agricultural production there focused on export-oriented commodities, mainly coffee, sugar, bananas, and other tropical fruits. Consequently, bilateral trade with the United States under CAFTA-DR continues to be an important factor in the economic development of El Salvador, Guatemala, and Honduras alike.

The Northern Triangle has a relatively young and work-eligible population, with 62 percent of the 32 million inhabitants between the working ages of 15 and 64. Of the total inhabitants (excluding students and unpaid caregivers), 42 percent are in the labor force, compared to 49 percent in the United States. As local economies expand and more people move into the formal labor sector, the labor force is expected to increase from 13.5 million people in 2016 to more than 15 million in 2021, providing additional purchasing power and increasing the demand for imported goods. Although the majority of the Northern Triangle’s population earns less than $20,000ii per year, buying power may be higher than indicated due to unrecorded income from sources including remittances from family members (primarily in the United States) and work in the informal sector. 

Participation in CAFTA-DR has created jobs and spurred economic growth across the Northern Triangle. Since 2006, the number of households in the region earning more than $20,000 per year has increased 40 percent, to nearly three million. Within the next five years, that number is expected to grow another 20 percent, to more than 3.5 million households. This is significant for U.S. exporters, since families with household incomes above the $20,000 threshold are likely to make their food purchases at modern retail centers and have more discretionary income to spend on imported foods.
 
The Northern Triangle imported $5.9 billion of agricultural products from the world in 2016. The United States was the top supplier, providing approximately 40 percent of those imports. Major U.S. competitors in the region are Mexico, the European Union, Chile, and Uruguay. Top U.S. agricultural exports to the Northern Triangle include corn, soybean meal, wheat, poultry, rice, and prepared foods.

Consumer demand for high-value products has increased in the Northern Triangle due to the population’s growing exposure to hypermarkets and modern retail chains. Another contributing factor has been awareness generated by marketing efforts such as SaborUSA, a U.S. industry effort supported by the U.S. Department of Agriculture, to promote American food products in Central and South America. 

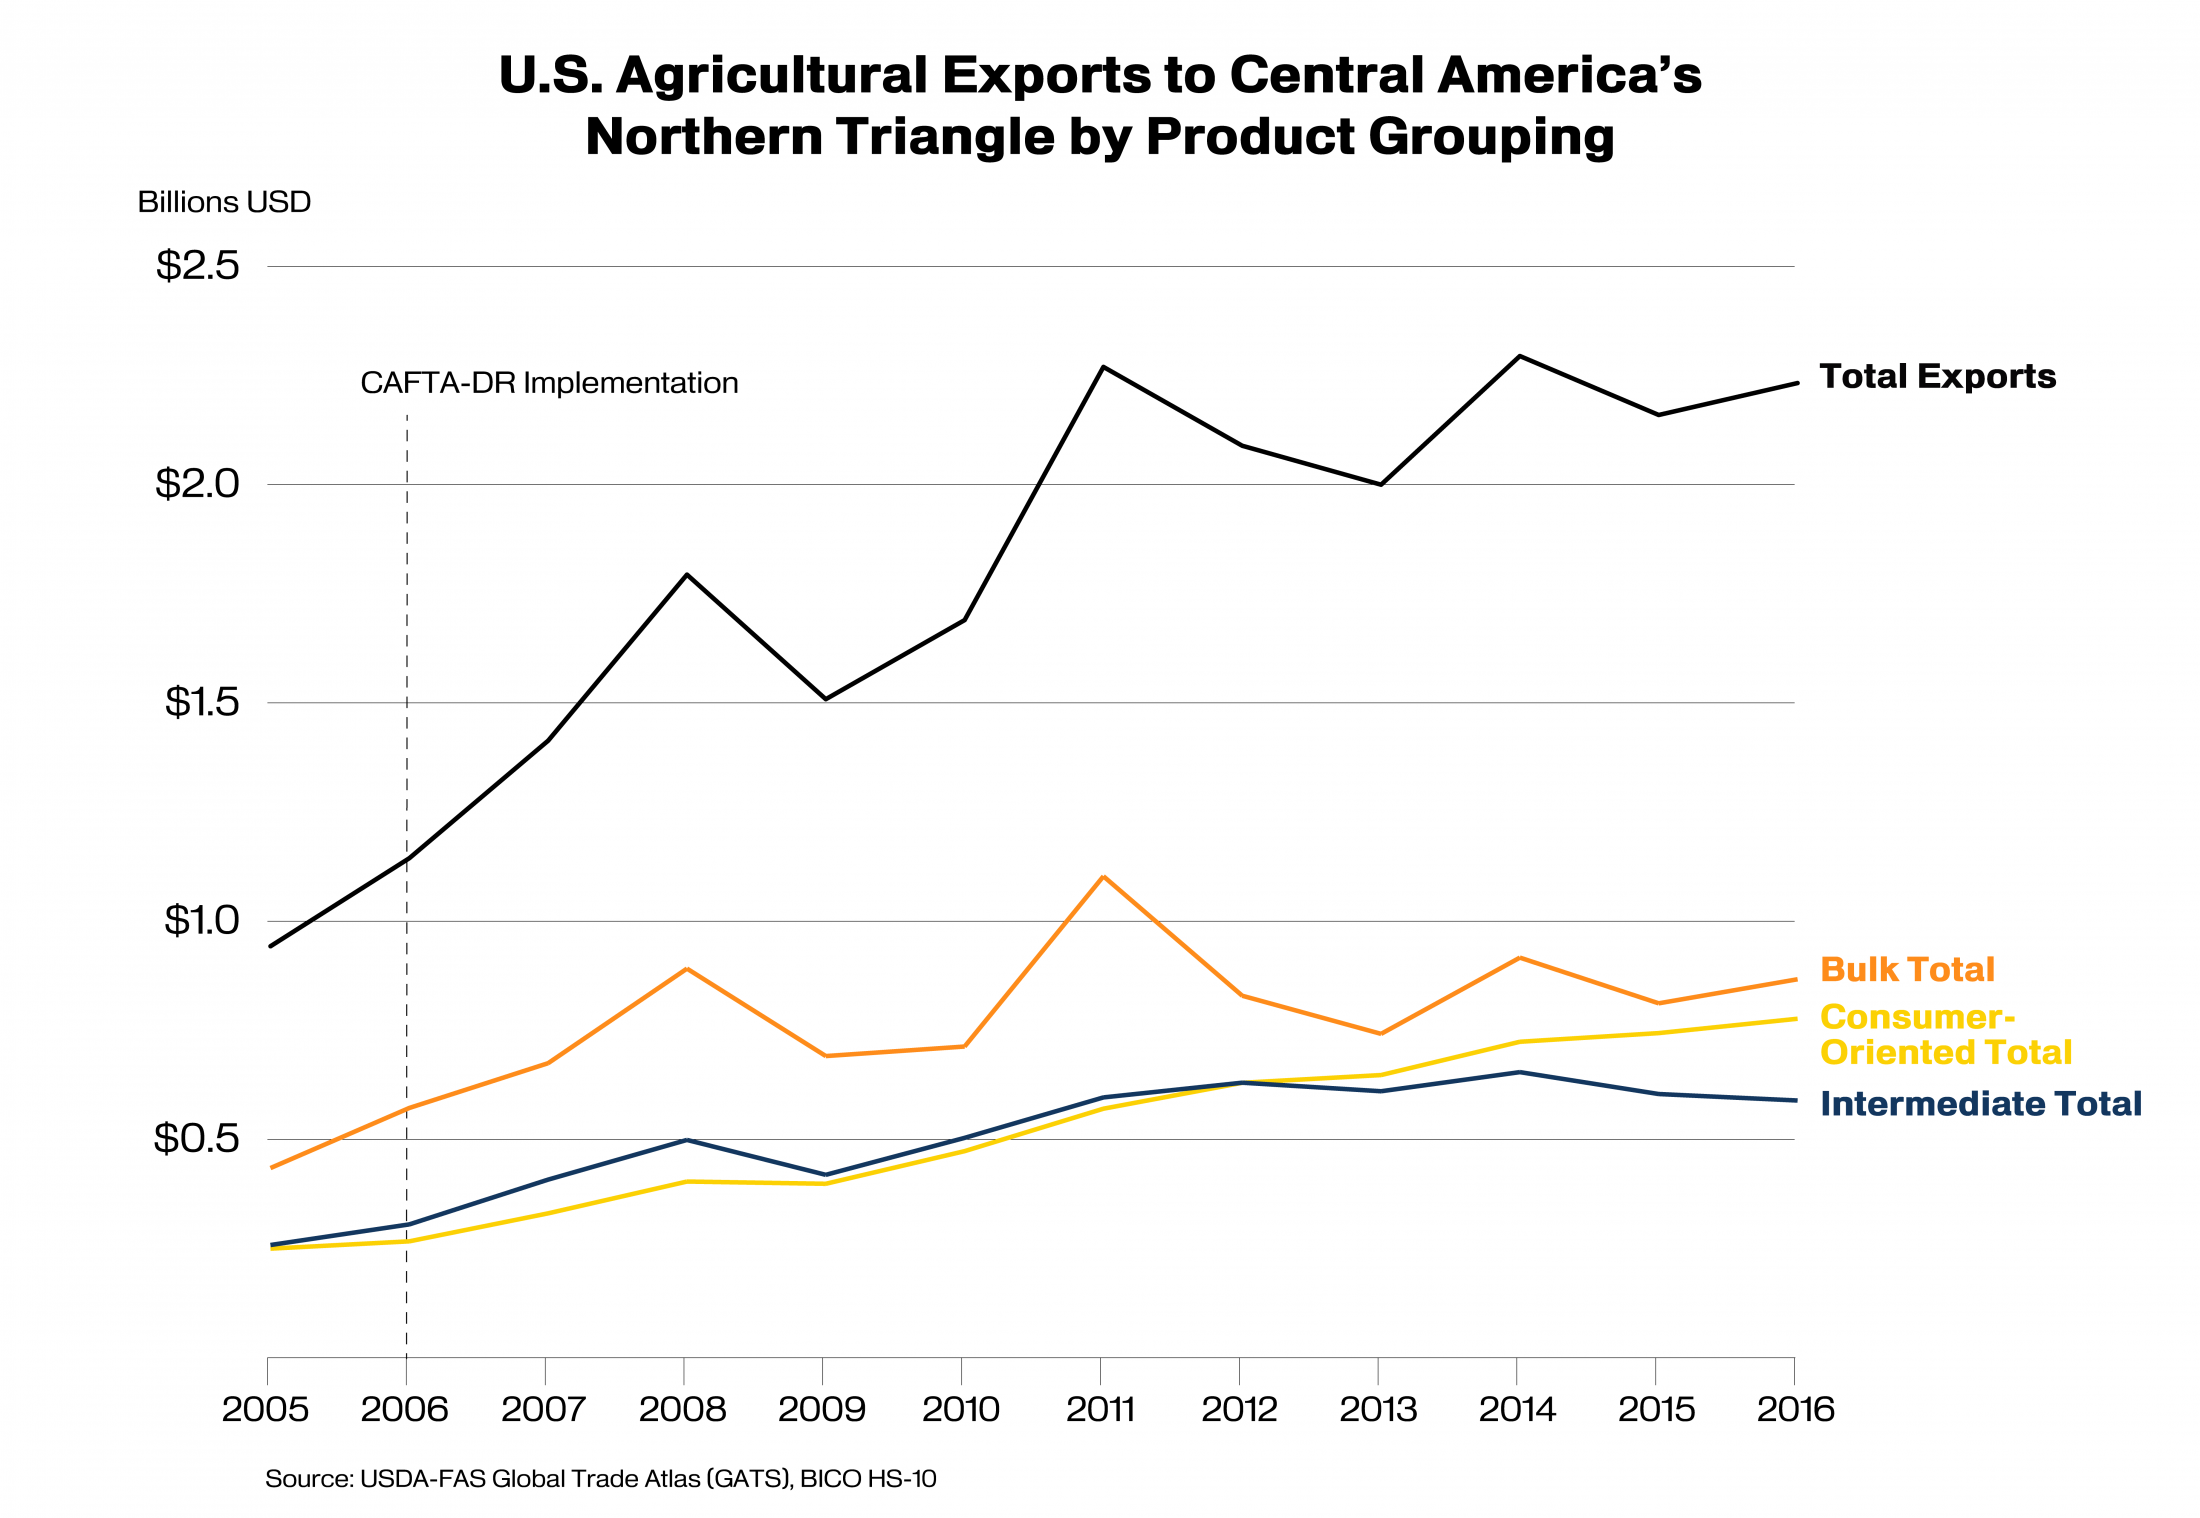
Retail food and beverages sales in the Northern Triangle countries have increased 33 percent since 2006, from $18.6 billion to $24.8 billion, and are expected to grow an additional 37 percent over the next decade.  Since 2006, consumer-oriented products have been the fastest-growing category of exports from the United States to the Northern Triangle, as indicated in the table below. In addition to convenience and consumer awareness, high domestic production costs have contributed to the growth in import demand. 

U.S. Agricultural Exports to Central America’s the Northern Triangle
(Values in Million US$)
Commodity
Product Group
Growth Since 2006
Average Exports
2014-2016
Corn
Bulk
97%
$360.6
 Soybean Meal
Intermediate
114%
$324.3
Wheat
Bulk
24%
$256.5
Poultry Meat & Prods. (ex. eggs)
Consumer-Oriented
248%
$137.3
Rice
Bulk
63%
$124.0
Prepared Food
Consumer-Oriented
216%
$109.5
Pork & Pork Products
Consumer-Oriented
241%
$97.7
Cotton
Bulk
3%
$96.4
Dairy Products
Consumer-Oriented
122%
$74.9
Fresh Fruit
Consumer-Oriented
48%
$53.8
Processed Vegetables
Consumer-Oriented
200%
$53.3
Soybean Oil
Intermediate
111%
$38.4
Beef & Beef Products
Consumer-Oriented
641%
$38.3
Chocolate & Cocoa Products
Consumer-Oriented
365%
$35.3
Distillers Grains
Intermediate
1321%
$33.9
All Other Agricultural Exports
N/A
69%
$394.7
Total Agricultural Exports
 
95%
$2,228.9
Source: USDA-FAS Global Agricultural Trade System (GATS),BICO HS-10

Line graph showing U.S. exports to Central America's Northern Triangle by country. Exports totaled $2.2 billion in 2016.
El Salvador
 
El Salvador has a population of approximately 6.3 million, with 2.9 million people in the labor force. Nearly 68 percent of the country’s citizens live in cities. The urban population is expected to grow an additional six percent by 2021, while the rural population is expected to decline five percent. 
 
Although 1.3 million Salvadoran households earn less than $20,000 year, the number of households above that threshold has grown over the past decade. With the country’s GDP forecast to rise 11 percent by 2021, the number of households earning more than $20,000 is expected to grow from 640,000 to 720,000 over the next five years.iii
 
El Salvador’s retail food and beverage sector incorporates a variety of hypermarkets, convenience stores, traditional “mom-and-pop” shops, and open-air markets. Retail food and beverage sales are expected to increase 11 percent over the next five years, led by growth in products such as non-alcoholic beverages and wine. Salvadoran importers seek products that that are competitive in both price and quality.
 
El Salvador’s top agricultural imports from the world include prepared foods, dairy products, corn, beef, and soybean meal. In 2016, the United States exported more than $504 million worth of agricultural products to El Salvador, an 84-percent increase from 2006. Top U.S. exports include corn, soybean meal, prepared food, wheat, and cotton. Since implementation of CAFTA-DR, the United States has been El Salvador’s top agricultural supplier, enjoying a 34-percent market share in 2016. 
 
Guatemala
 
Guatemala has a population of 15.5 million, with nearly 56 percent living in cities. Guatemala has the largest middle class among the Northern Triangle countries, with nearly 1.8 million households. Although the country’s population is only projected to grow 10 percent in the next five years, a projected 30-percent increase in middle-class households will contribute to 19-percent growth in GDP and a 20-percent jump in retail food and beverage sales.iii 
 
The majority of Guatemalan households consume mostly for subsistence, while the 190,000 households that earn $50,000 or more hold almost half of country’s overall wealth. This unequal income distribution is a major factor limiting Guatemala’s demand for imported goods. As more families move into the middle class, income inequality will decline and household purchasing power will expand, helping to generate demand for meats and other high-value foodstuffs. Other factors contributing to that demand include remittances from overseas workers, Guatemalans’ familiarity with U.S. culture, and tourism. Growth in hotels, restaurants, and supermarkets has increased retail food and beverage sales from $10.7 billion in 2006 to $15.3 billion in 2016. 
 
Guatemala’s top agricultural imports from the world include prepared food, corn, dairy products, soybean meal, and essential oils. With 90-percent market share, the United States is the largest supplier and Guatemala ranks as the 21st-largest export destination for U.S. agriculture. In 2016, U.S. agricultural exports to Guatemala were worth more than $1 billion, led by corn, soybean meal, wheat, poultry meat, and cotton. Since implementation of CAFTA-DR in 2006, U.S. exports to Guatemala have nearly doubled, with high-value products such as processed foods experiencing the fastest growth. Top U.S. competitors in the Guatemalan market are the other CAFTA-DR countries, as well as Mexico and the European Union.
 

Honduras

Honduras has the lowest GDP of the Northern Triangle countries, but is the fastest-growing economy. The majority of the 9.1 million Hondurans live in cities. The urban population is expected to grow another 30 percent by 2021, while rural population growth is forecast at just one percent. Within the same period, Honduras’ GDP is expected to increase 20 percent, compared to the projected 19-percent increase for Guatemala and 11-percent increase for El Salvador. 
 
Along with GDP growth, the number of Honduran households earning more than $20,000 is expected to grow 26 percent by 2021, to 540,000 households. Expansion of the country’s middle class and influence from neighboring countries have contributed to a 36-percent increase in retail food and beverage over the past decade, from $2.9 billion in 2006 to nearly $4 billion in 2016.  
 
Honduras’ top agricultural imports from the world include prepared food, corn, soybean meal, wheat, and dairy products. During the past decade, U.S. agricultural exports to Honduras have nearly doubled, from $323 million in 2006 to $642 million in 2016. Top U.S. exports include corn, soybean meal, rice, wheat, and pork and pork products.  The United States is the largest supplier of food and agricultural products to Honduras, enjoying a market share of nearly 43 percent. Top U.S. competitors in the Honduran market are the other CAFTA-DR countries, as well as Mexico and the European Union. 


iReferences to GDP are in 2010 Purchasing Power Parity (PPP). PPP is an economic theory that adjusts a country’s GDP using a "basket of goods" approach that takes into account differences in the costs of goods in different countries. This approach is generally regarded as the best comparison of domestic well-being among different countries.

iiReferences to household income throughout this report are in 2005 PPP.

iiiSource: IHS Markit Global Consumer Markets Service

ivSource: Euromonitor International

Related Reports

International Agricultural Trade Report

Growth Potential for U.S. Agricultural Products in Senegal

While the United States holds a 5-year average of less than 1 percent market share ($20.7 million in 2023 exports), Senegal has a growing food manufacturing industry that seeks cost-competitive ingredients and is expanding its exports to neighboring countries.
International Agricultural Trade Report

Opportunities for U.S. Agricultural Products in Morocco

In 2023, Morocco was the second-largest export market for U.S. agriculture on the African continent, importing over $610 million in U.S. agricultural products, accounting for over 16 percent of all U.S. exports to Africa. The United States has seen total exports quadruple and agricultural exports double since entering into a free-trade agreement (FTA) with Morocco in 2006.
During the past few years, the landscape for U.S. renewable diesel production has drastically changed, akin to the growth of ethanol and biodiesel during the past two decades. Driven by federal and state policies aimed at reducing emissions, this dramatic U.S. renewable diesel production and capacity growth is causing significant, market-altering shifts both domestically and to foreign feedstock trade.