
Spotlight: Top U.S. Fruit Export Markets
Contact:
Link to report:
Summary
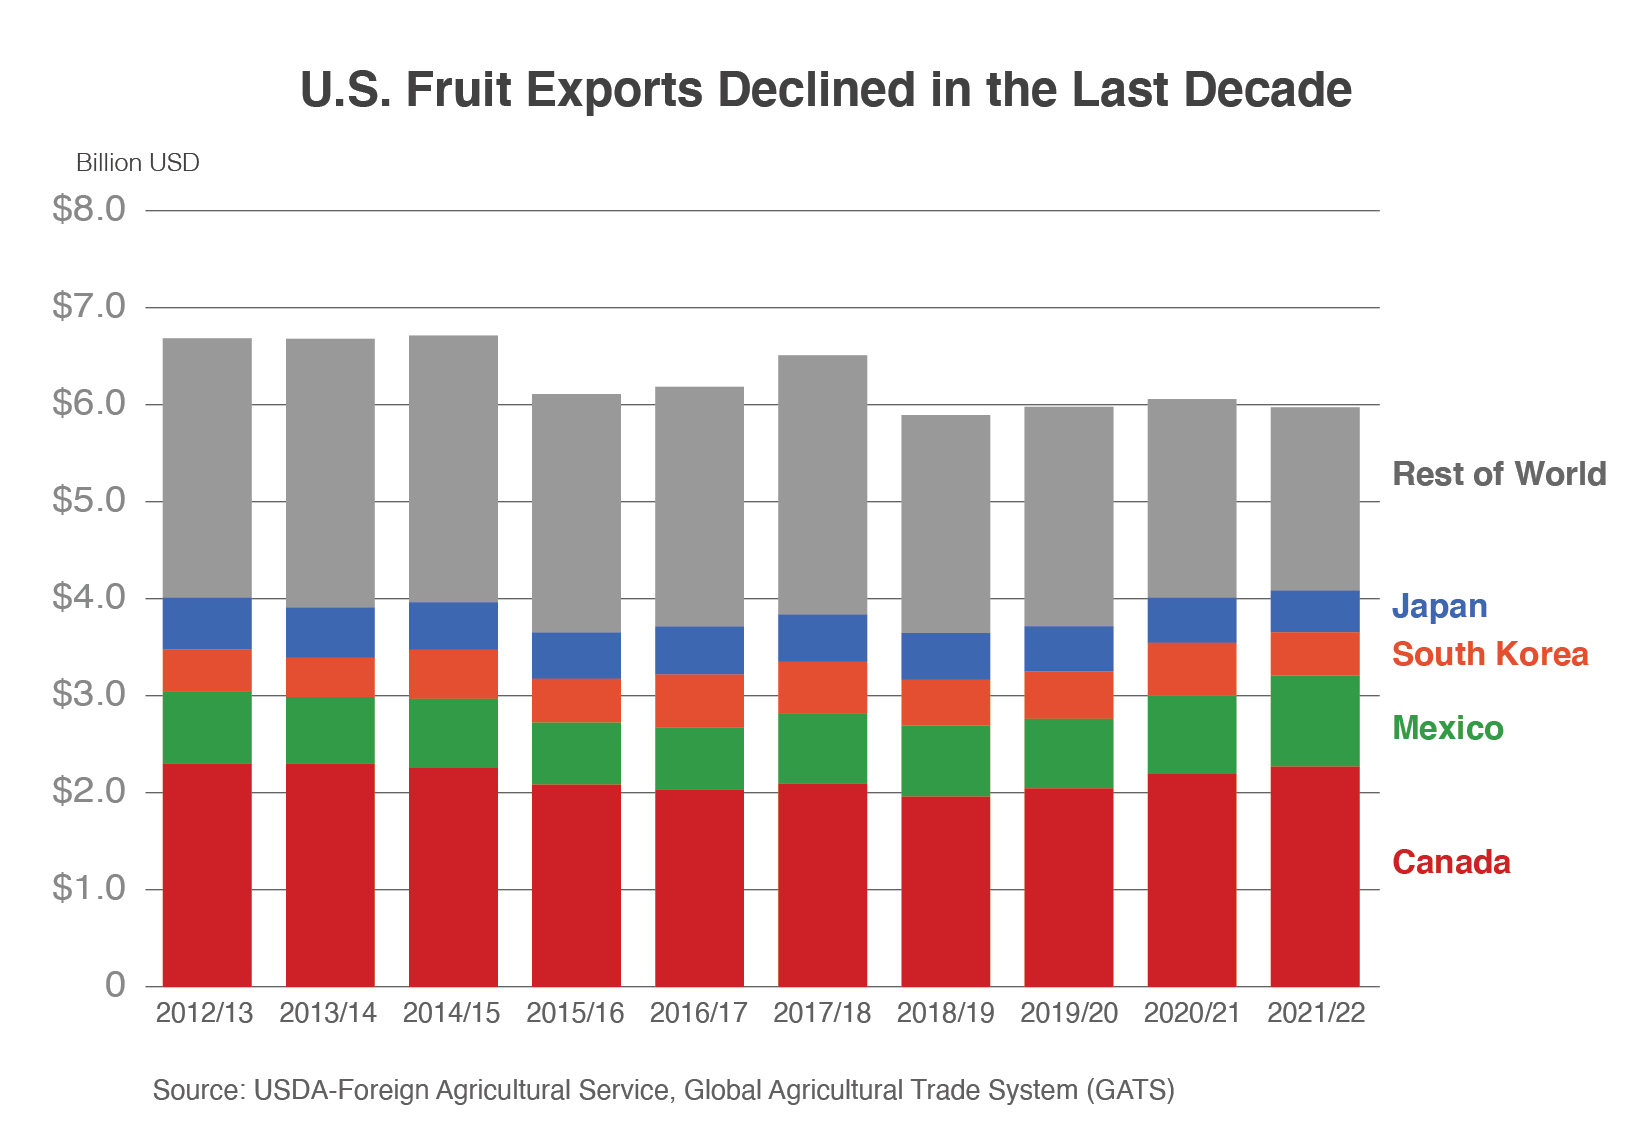
The volume of U.S. fresh, dried, and processed fruit exports between 2012/13 and 2021/22 dropped 29 percent to 2.9 million metric tons1. However, a 25-percent gain in unit value during this period softened the decrease in value to just 11 percent lower as trade dropped $700 million to $6.0 billion. A contributing factor to lower export volumes was a contraction in production for most of the top export commodities. However, this situation was partially offset by rising exports to Canada and Mexico due to the U.S. advantage as a border country transporting perishable goods as well as differences in growing seasons between the United States and other countries supplying these markets. In 2021/22, top U.S.fruit markets were Canada, Mexico, the Republic of Korea (South Korea), and Japan, and top commodities included apples, grapes, strawberries, oranges, and cherries.
Canada
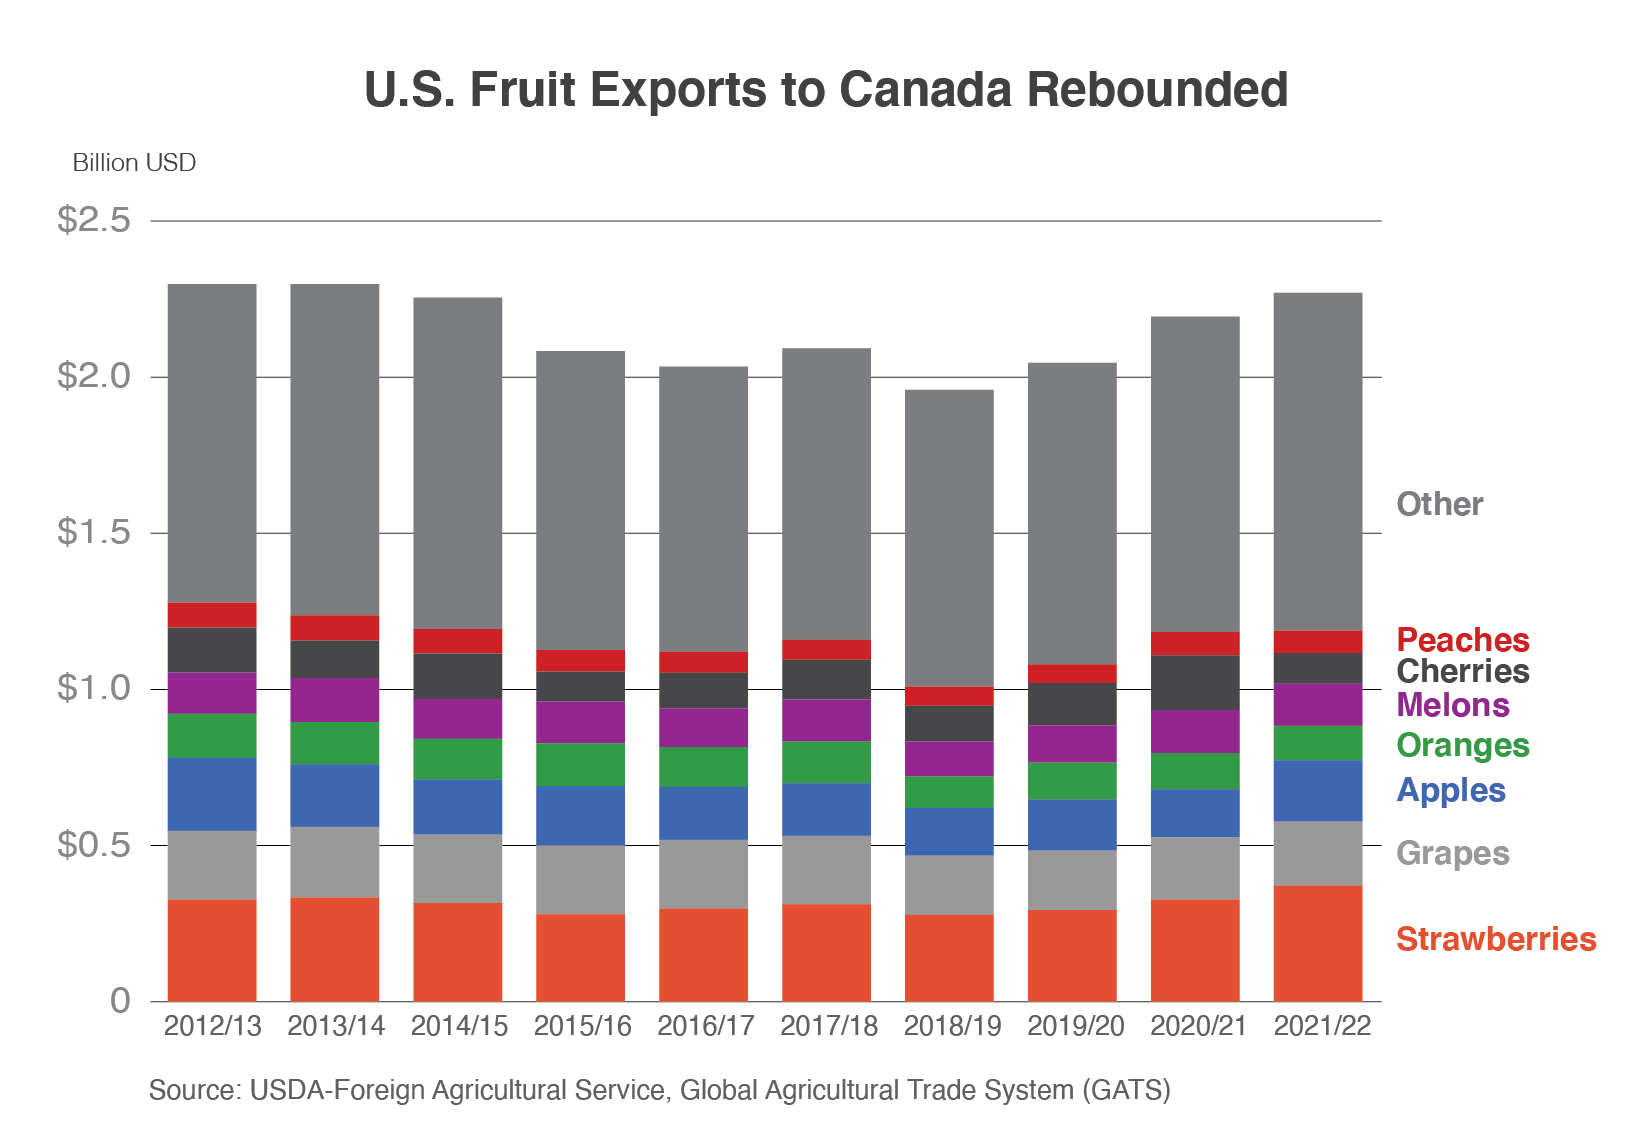
During the last 10 years, U.S. exports to Canada declined for several years before staging a rally to finish nearly unchanged at $2.3 billion. In 2021/22, top commodities included strawberries ($371 million), grapes ($206 million), and apples ($196 million). Canada was the top U.S. strawberry and grape market and second-largest apple market.
- The value of strawberry exports increased 13 percent in the last 10 years, but this was driven by unit value rising nearly 40 percent as volume decreased 18 percent. Exportable supplies were reduced by a 13-percent decline in U.S. production. Also, competition from Mexico during this period cut U.S. market share from 91 percent to 84 percent as Mexico increased exports during its peak shipping months of December through February, a period of reduced shipments from the United States.
- Grape exports decreased 6 percent by value and 10 percent by volume the last decade, with unit value rising modestly. Exports mainly occur between July and November and face limited competition from Mexico, Chile, and Peru because most shipments from these countries arrive outside this period due to different growing seasons.
- Apple export volume increased 6 percent in the last 10 years but suffered a 16-percent decline in value as unit value dropped 21 percent. Export volume was supported by rising output. The United States increased its market share slightly during this period to 84 percent at the expense of Chile and New Zealand.
Mexico
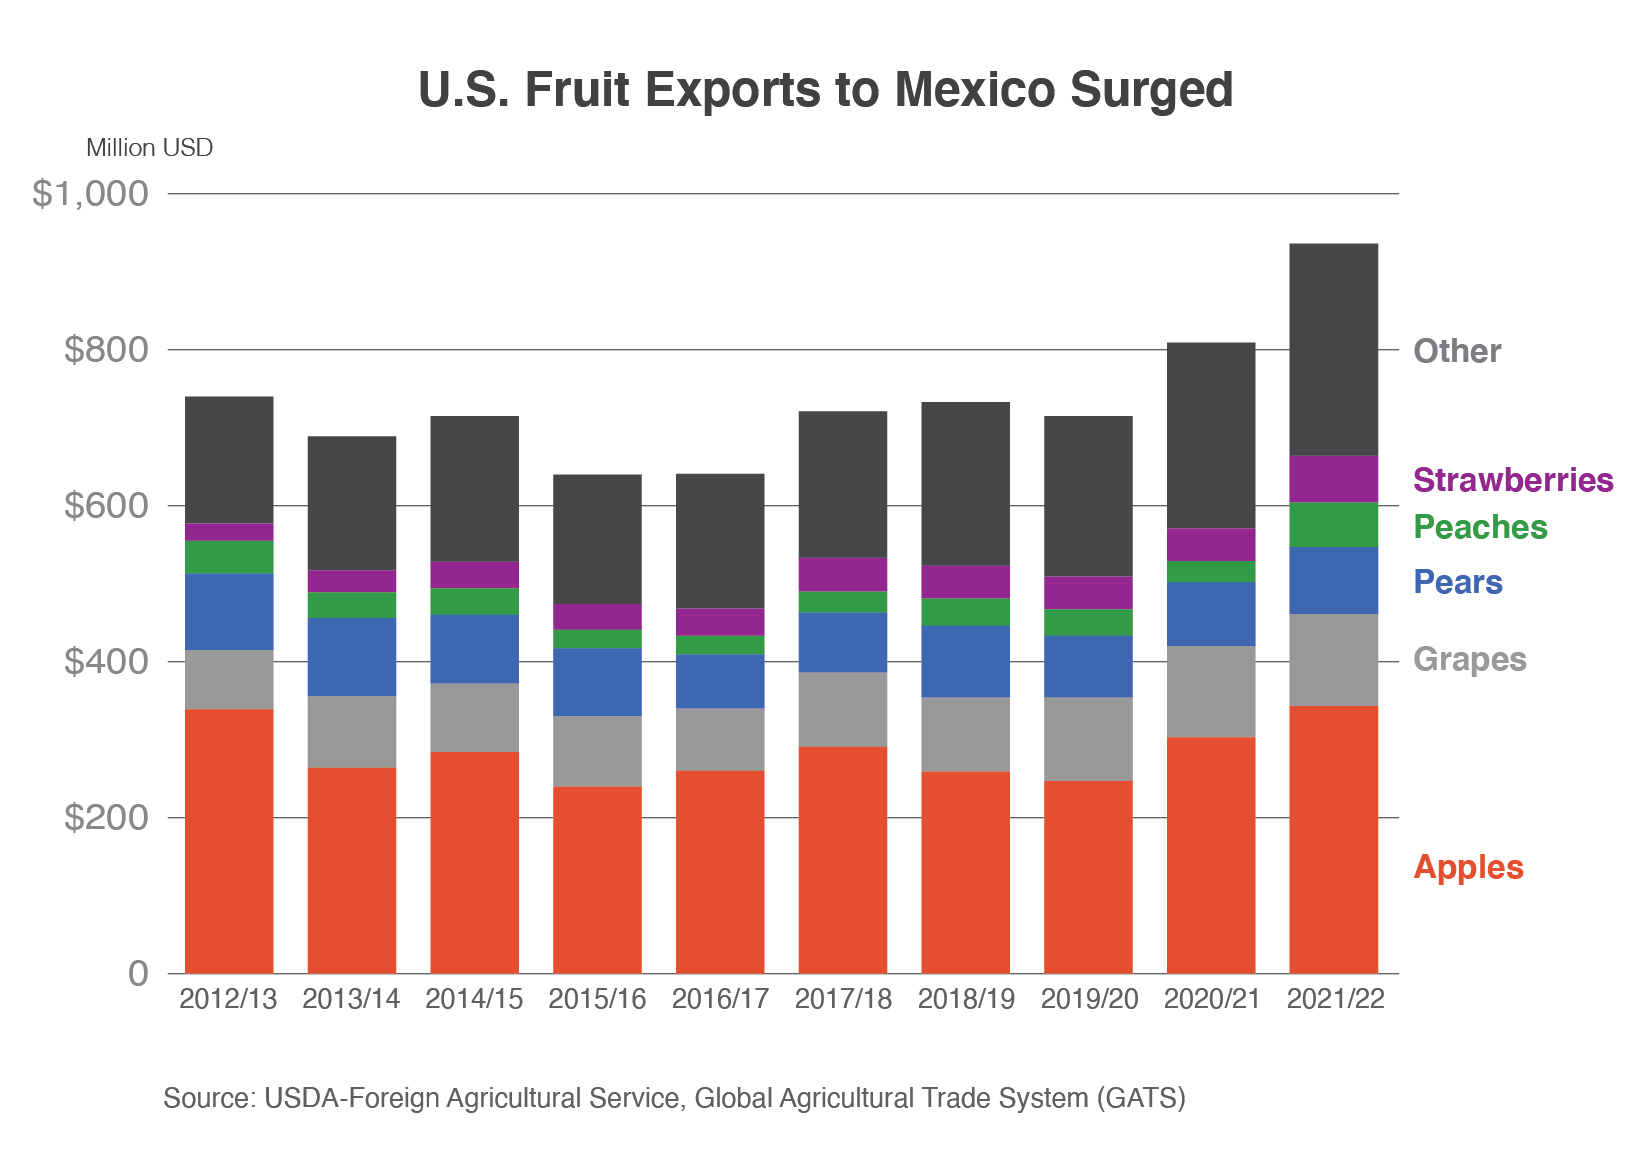
U.S. exports to Mexico in the last 10 years rose nearly $200 million to $936 million, most of which occurred during the last 2 years on strong apple shipments. In 2021/22, top commodities included apples ($343 million), grapes ($118 million), and pears ($86 million). Mexico was the top U.S. apple and pear market and second-largest grape market.
- Apple export volume increased 7 percent in the last 10 years but increased just 1 percent in value as unit value dropped 5 percent. The United States had more than 96 percent market share, with limited competition from Chile.
- Grape exports jumped more than 50 percent by volume and value with a marginal increase in unit value. Exports mainly occur between July and December and face limited competition from Chile and Peru due to different growing seasons.
- Pear export volume and value were down 18 percent and 12 percent, respectively, but the decline was somewhat offset by unit value gaining 7 percent. In the last decade, rising competition cut U.S. market share from 96 percent to 87 percent as Argentina increased exports during its peak shipping months of May through August, a period of reduced shipments from the United States.
South Korea
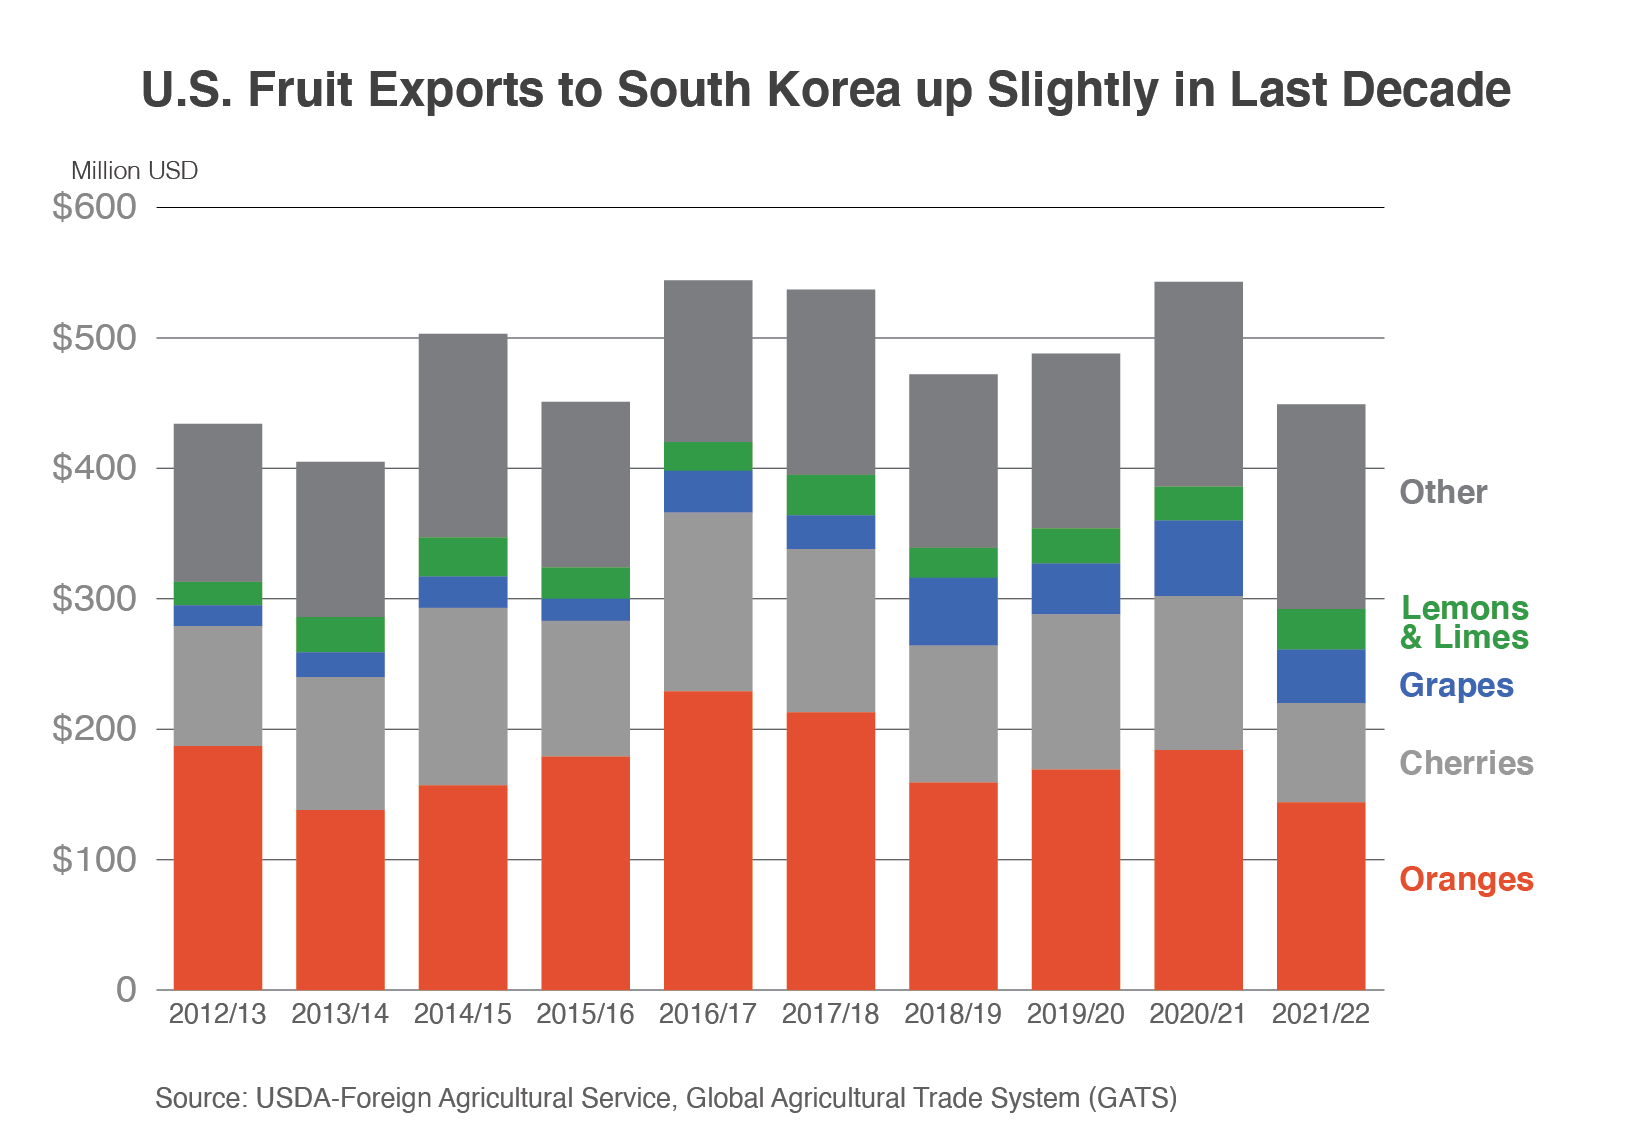
U.S. exports to South Korea in the last 10 years were up $13 million to $448 million, but top commodities oranges and cherries have been declining for several years. In 2021/22, exports were driven by oranges ($144 million), cherries ($76 million), and grapes ($41 million). South Korea was the top U.S. orange market, second-largest cherry market, and fourth-largest grape market.
- Although the unit value of orange exports increased 46 percent in the last 10 years, this was more than offset by reduced shipments. Despite having virtually no competition during its primary shipping months January through June, U.S. orange exports have plummeted primarily due to reduced output in California, where most of the exports occur. South Korea has recently begun importing larger quantities from Australia between July and November, but these oranges do not compete with U.S. supplies.
- Cherry export volume was down 40 percent, but export value dropped just 18 percent due to unit value gaining 38 percent. With most production going towards domestic consumption, declining output during the decade reduced exportable supplies. South Korea has recently begun importing larger quantities from Chile between November and March, but these cherries do not compete with U.S. supplies arriving between May and August.
- Grape export volume surged 70 percent and value more than twice that as unit value gained nearly 50 percent. Exports have limited competition from Chile and Peru due to different growing seasons and could continue to rise.
Japan
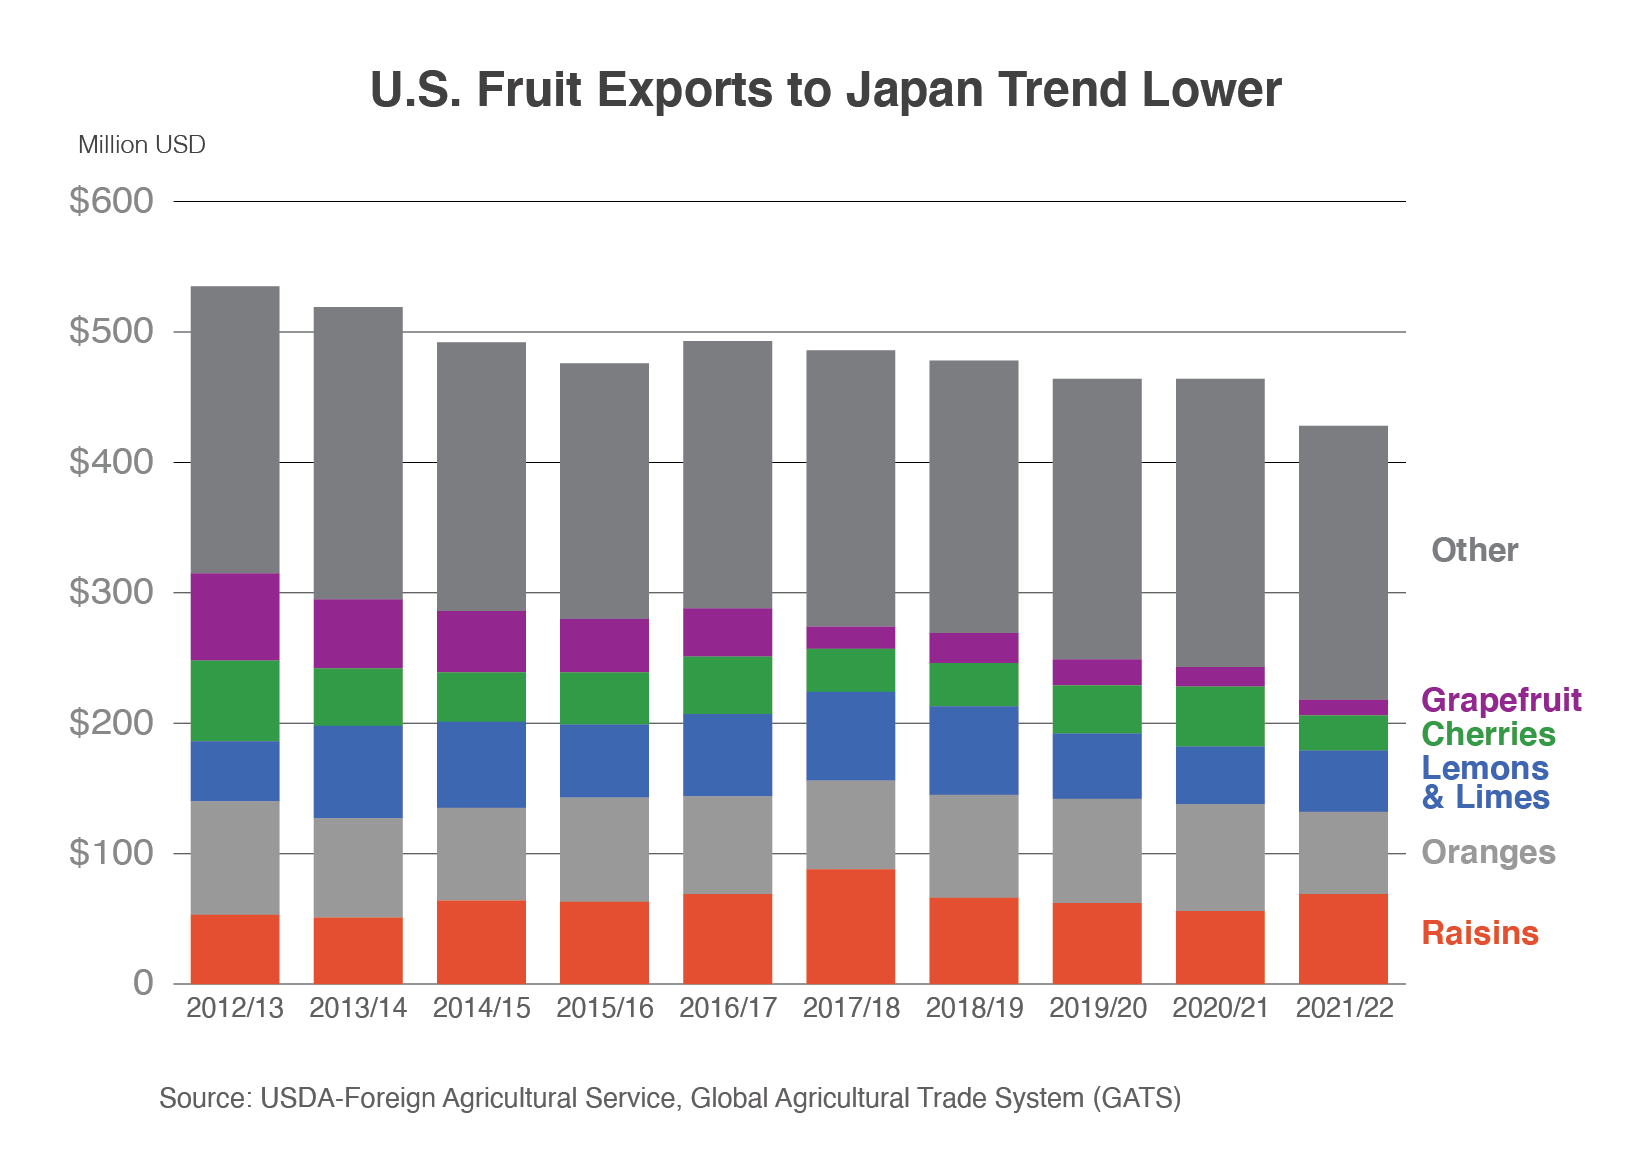
U.S. exports to Japan during the last decade dropped $106 million to $429 million, driven by a sharp reduction in exportable supplies of grapefruit. In 2021/22, top commodities included raisins ($69 million), oranges ($63 million), and grapes ($42 million). Japan was the top U.S. raisin market and third-largest orange and grape market.
- Raisin exports gained more than 30 percent by value and volume while unit value slipped a modest 3 percent. Despite these gains, rising competition from Turkey lowered U.S. market share from 90 to 75 percent.
- Although the unit value of orange exports increased 56 percent in the last 10 years, this was more than offset by volume and value falling 53 percent and 27 percent, respectively. Exports cratered on lower exportable supplies. As in South Korea, Japan has recently begun importing larger quantities from Australia.
- Grape export volume and value gained more than 60 percent with a slight increase in unit value. Exports mainly occur between July and December and face limited competition from Mexico during this period.
Conclusion
These top markets accounted for about two-thirds of U.S. fresh, dried, and processed fruit exports. Key gains to these markets during the period included grapes and strawberries but were largely offset by losses from oranges, cherries, and apples.
1 Split-year references for trade data refer to July through June.
Market share information is from Trade Data Monitor, LLC.