
Colombia Rice TRQ Unfilled for the First Time
Contact:
Link to report:
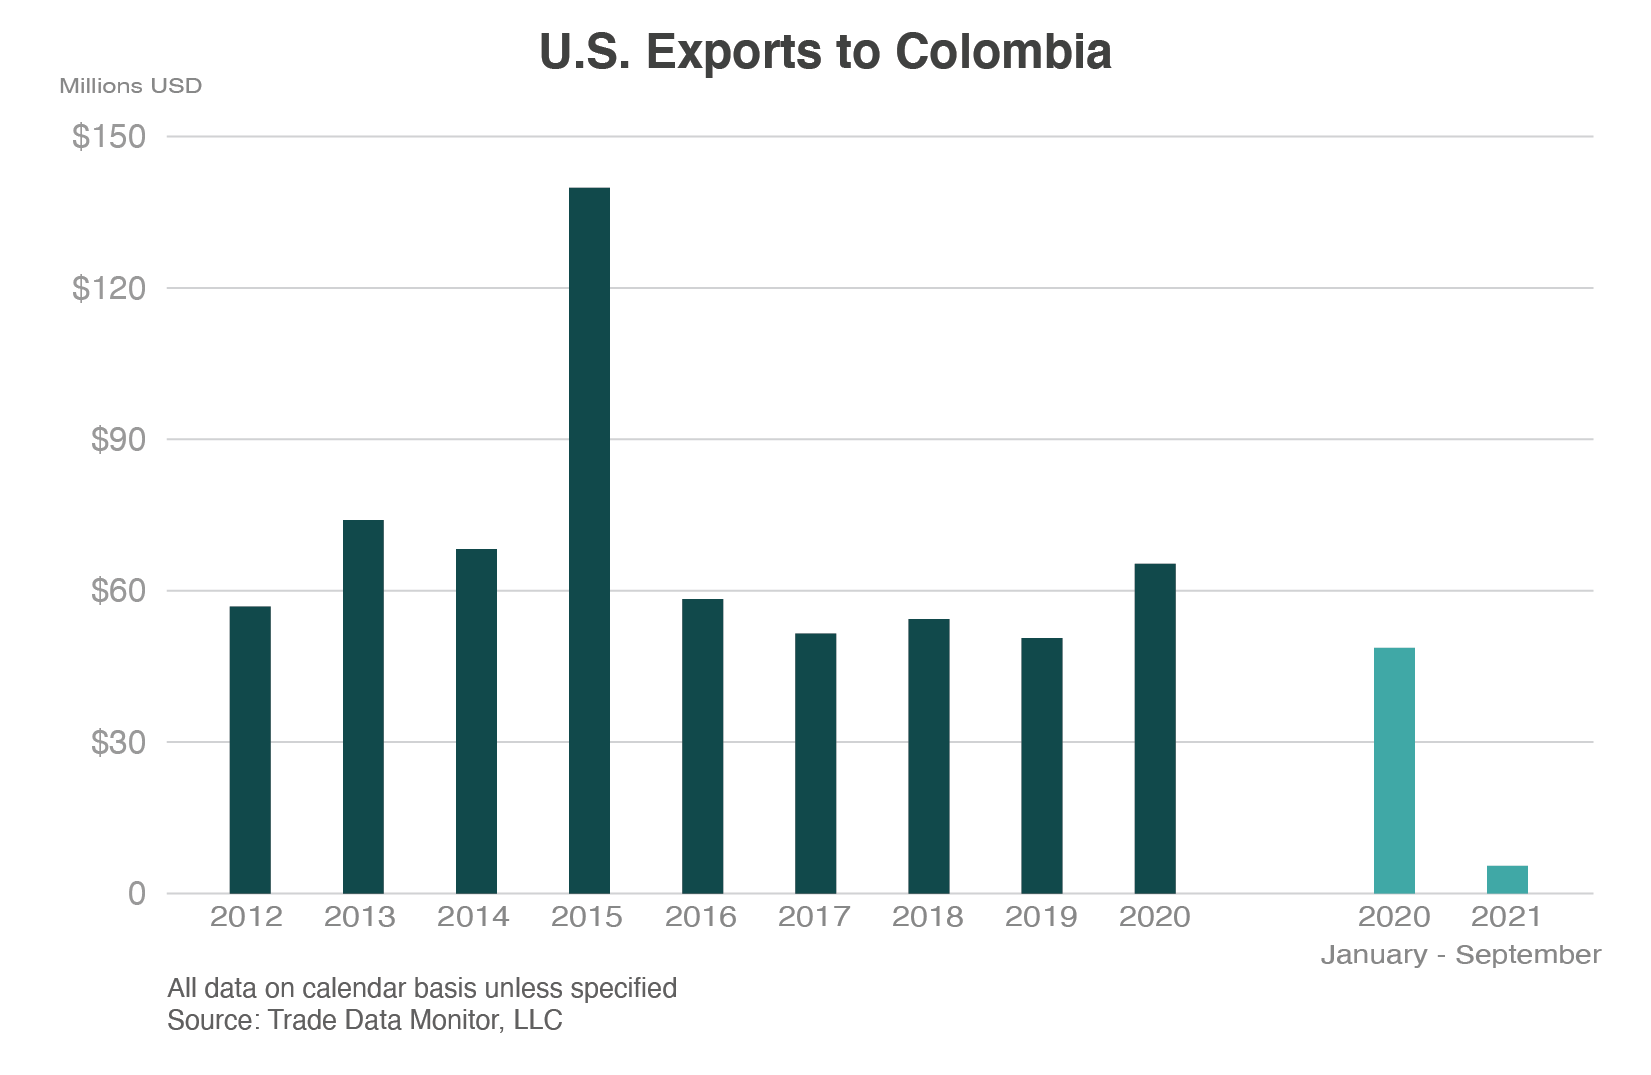
In 2021, despite advantages offered through the United States-Colombia Trade Promotion Agreement (TPA), U.S. rice exports to Colombia have declined to just $5 million through September. The significantly lower exports to this market are a result of a larger Colombian crop and lower domestic prices, plus increased competition from South American exporters. This is a significant development for U.S. rice exporters since 2020, when Colombia was the eighth-largest destination for U.S. rice by value.
Since the TPA was enacted on May 15, 2012, with shipments soaring upon implementation, U.S. exporters have consistently filled the tariff-rate quota (TRQ) at 100 percent until 2021. In 2011, before implementation, U.S. rice exports to Colombia were only $3 million. The TPA went into effect in 2012, allowing an initial 79,000 tons of U.S. rice exports to enter duty-free compared to out-of-quota tariff rates of 80 percent. As a result, exports jumped to roughly $57 million in 2012, rising twenty-fold.
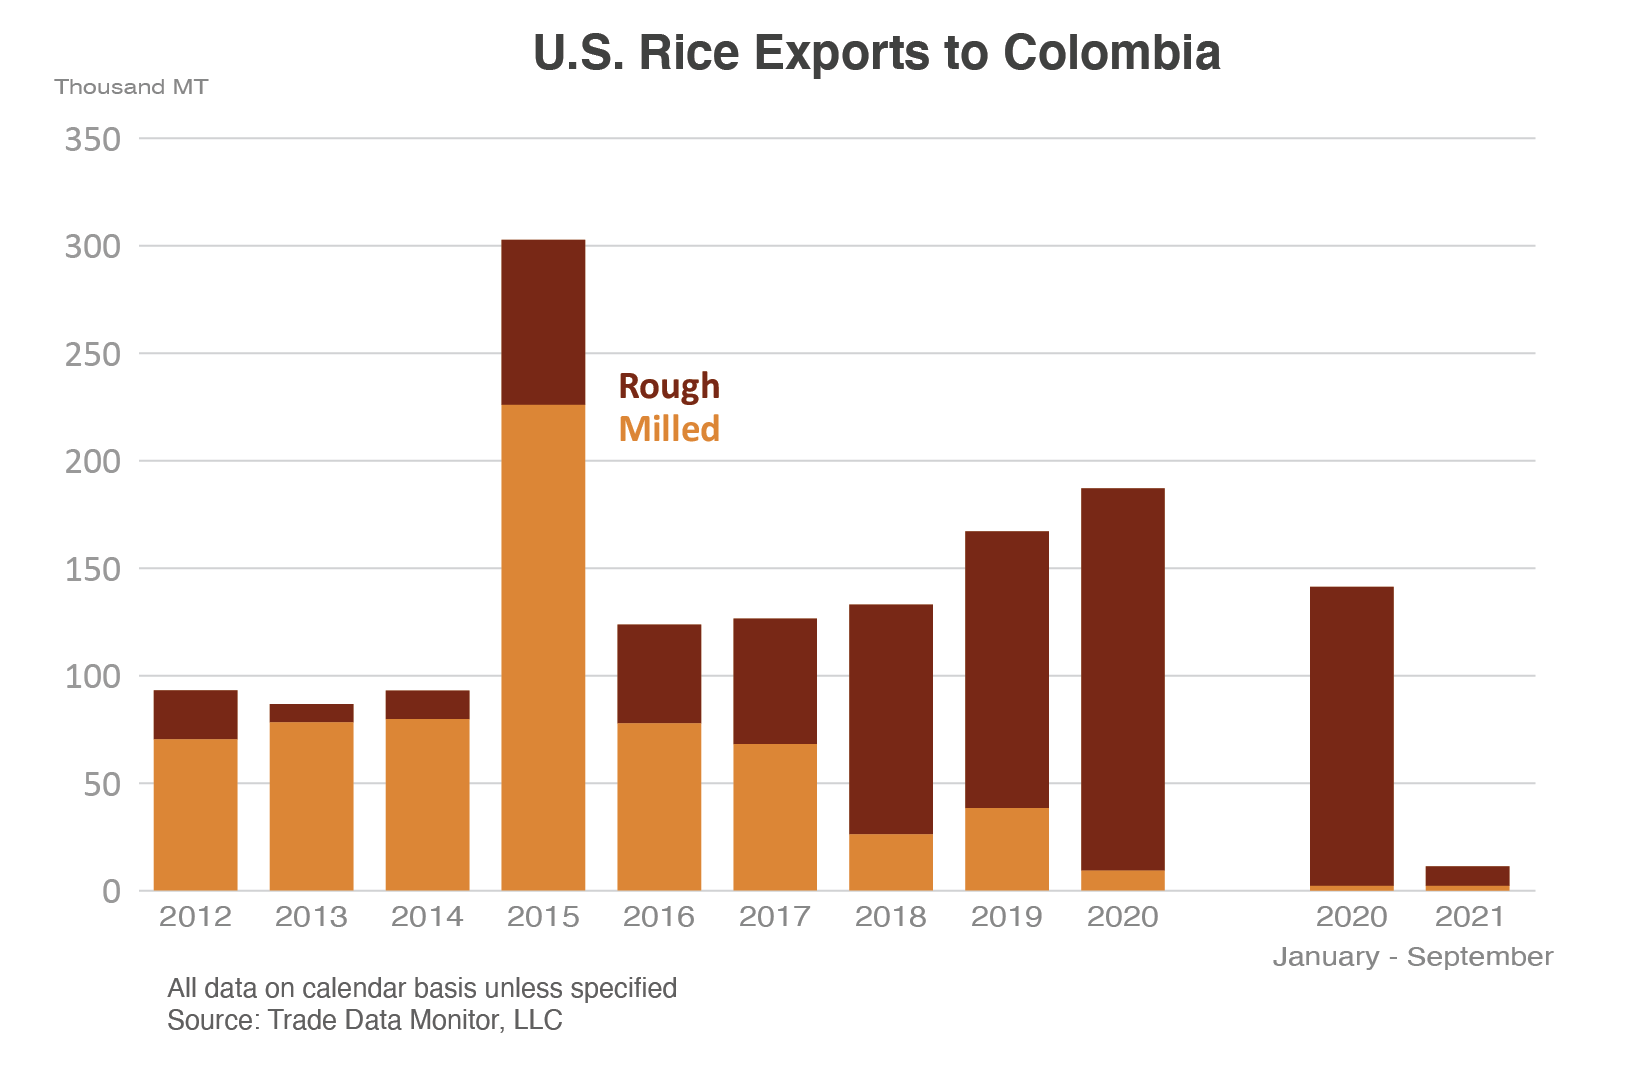
When sales to Colombia began to rise under the TPA, the United States mainly exported milled rice. U.S. rough (unmilled) rice was restricted to entering Colombia through one port due to concerns about the plant pest Tilletia horrida. However, the Colombian Agricultural Institute released the phytosanitary certificate for rough rice outlining required fumigation measures in 2017. The certificate permitted the entry of U.S. rough rice into all maritime ports and enabled U.S. exporters to respond to pent-up market demand. Since 2018, U.S. rice exports have been primarily rough rice. In 2020, Colombia was the second-largest destination for U.S. rough rice.
The TPA enabled growth in U.S. rice exports to Colombia and provides incentives on both sides to fill the TRQs specified under the TPA. The agreement allows U.S. sellers to bid on a specific amount of the listed quota at auctions three times each year, awarding the quotas to the highest priced bidders. As motivation to fill the auction quotas, both U.S. and Colombian rice industries evenly divide and distribute the auction proceeds to their respective industries for rice research.
U.S. traders continue to face a tariff for out-of-quota exports. In 2012, out-of-quota duty rates were 80 percent, the same rate that other competitors faced. However, since 2018, tariff rates for U.S. rice have declined by 4.5 percentage points every year under the TPA. The current out-of-quota tariff rate is 55.4 percent. By 2030, tariff rates will fall to zero upon full implementation of the TPA.
| Colombia Rice Export Quota (MT) | |||||
| Auctions | Jan/Feb | June | October | Total | Total Awarded |
| 2012 | N/A | N/A | 79,000 | 79,000 | 79,000 |
| 2013 | 53,000 | 12,000 | 17,555 | 82,555 | 82,555 |
| 2014 | 60,412 | 12,540 | 13,318 | 86,270 | 86,270 |
| 2015 | 63,131 | 13,104 | 13,917 | 90,152 | 90,152 |
| 2016 | 65,972 | 13,694 | 14,543 | 94,209 | 94,209 |
| 2017 | 68,940 | 14,311 | 15,197 | 98,448 | 98,448 |
| 2018 | 72,043 | 14,955 | 15,881 | 102,879 | 102,879 |
| 2019 | 75,284 | 15,628 | 16,596 | 107,508 | 107,508 |
| 2020 | 78,672 | 16,331 | 17,343 | 112,346 | 112,346 |
| 2021 | 82,213 | 17,066 | 18,123 | 117,402 | 7,480 |
| 2021 (awarded) | 6,591 | 543 | 346 | 7,480 | 7,480 |
The table above reports the auctions and amounts awarded between the United States and Colombia since the agreement. The amounts awarded are then shipped to Colombia duty-free. The 2021 January auction was the first time a listed quota was not awarded in its entirety. Similarly, in the second and third 2021 auctions only a fraction was awarded from the listed allotments.
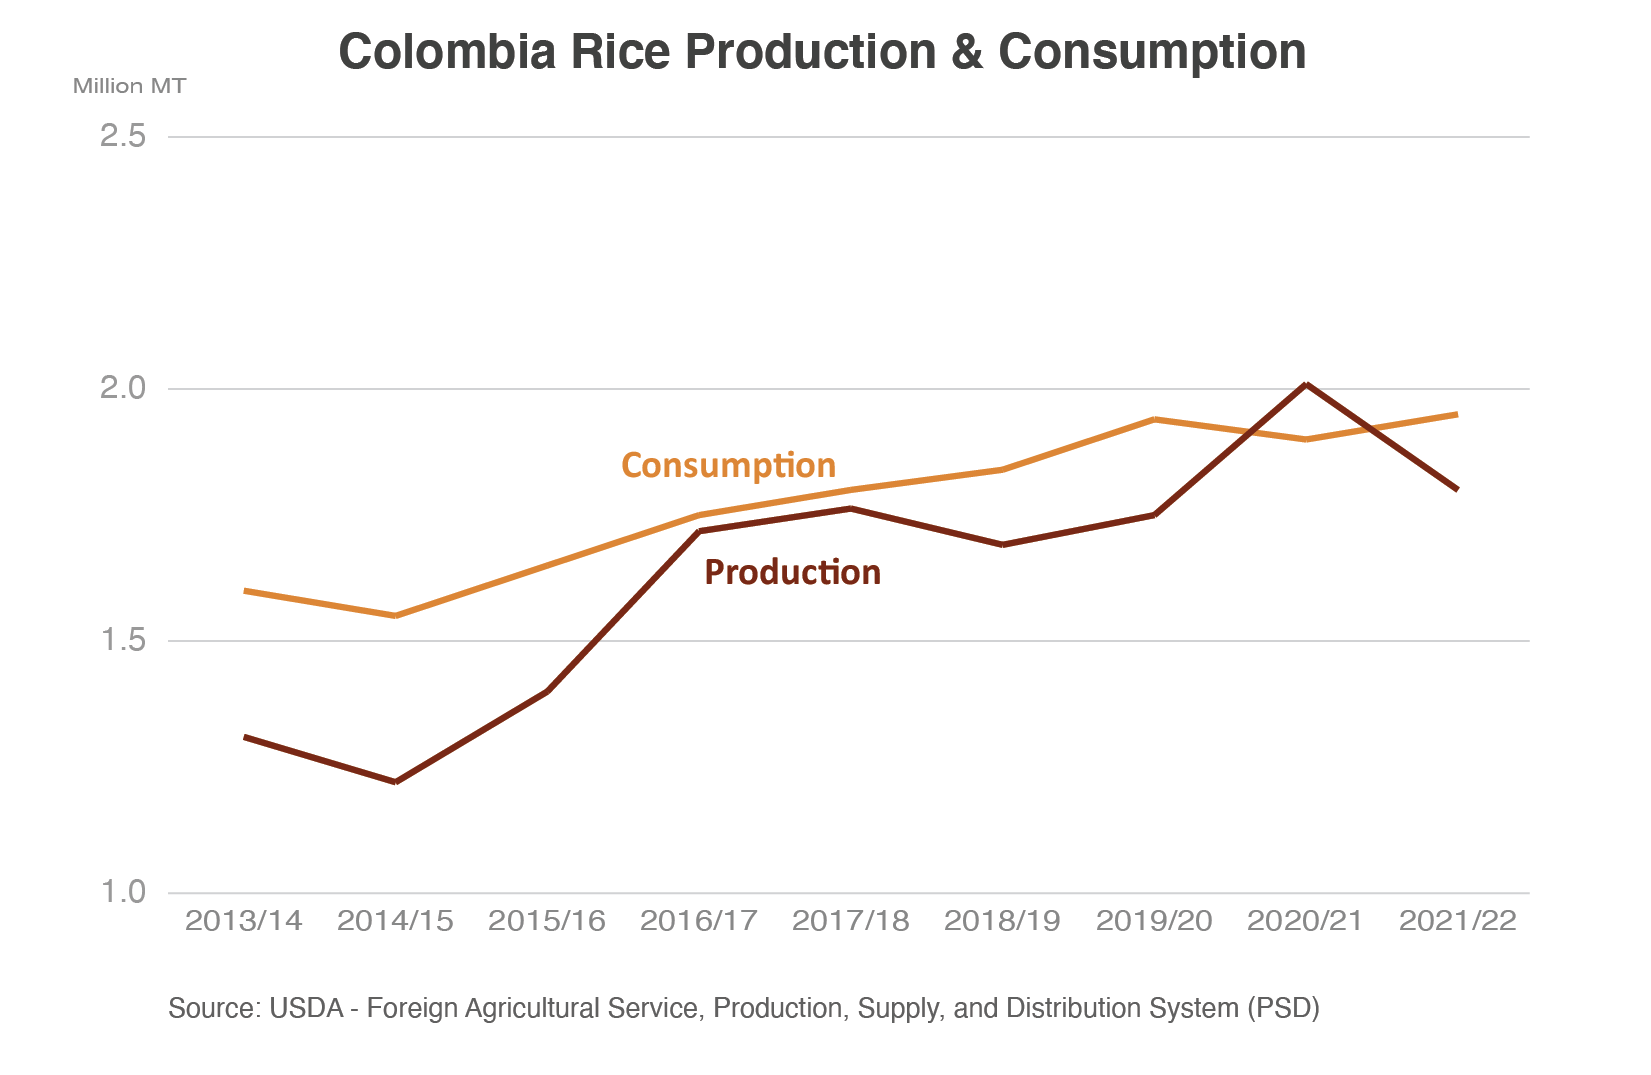
There are a few reasons why the quota has not been filled in 2020/21. The primary reason is rising rice production in Colombia led to lower domestic prices. The record 2020/21 production was nearly one-third larger than the previous year, resulting from record harvested area and higher yields. Due to the record crop and the addition of ample carry-over stocks, domestic rice prices within Colombia have fallen.
| Phase out | Year | TRQ (MT) | Out-of-quota Duty |
| Year 1 | 2012 | 79,000 | 80.0% |
| Year 2 | 2013 | 82,555 | 80.0% |
| Year 3 | 2014 | 86,270 | 80.0% |
| Year 4 | 2015 | 90,152 | 80.0% |
| Year 5 | 2016 | 94,209 | 80.0% |
| Year 6 | 2017 | 98,448 | 80.0% |
| Year 7 | 2018 | 102,879 | 73.8% |
| Year 8 | 2019 | 107,508 | 67.7% |
| Year 9 | 2020 | 112,346 | 61.5% |
| Year 10 | 2021 | 117,402 | 55.4% |
| Year 11 | 2022 | 122,685 | 49.2% |
| Year 12 | 2023 | 128,205 | 43.1% |
| Year 13 | 2024 | 133,975 | 36.9% |
| Year 14 | 2025 | 140,003 | 30.8% |
| Year 15 | 2026 | 146,304 | 24.6% |
| Year 16 | 2027 | 152,887 | 18.5% |
| Year 17 | 2028 | 159,767 | 12.3% |
| Year 18 | 2029 | 166,957 | 6.2% |
| Year 19 | 2030 | Unlimited | 0.0% |
Source: World Trade Organization
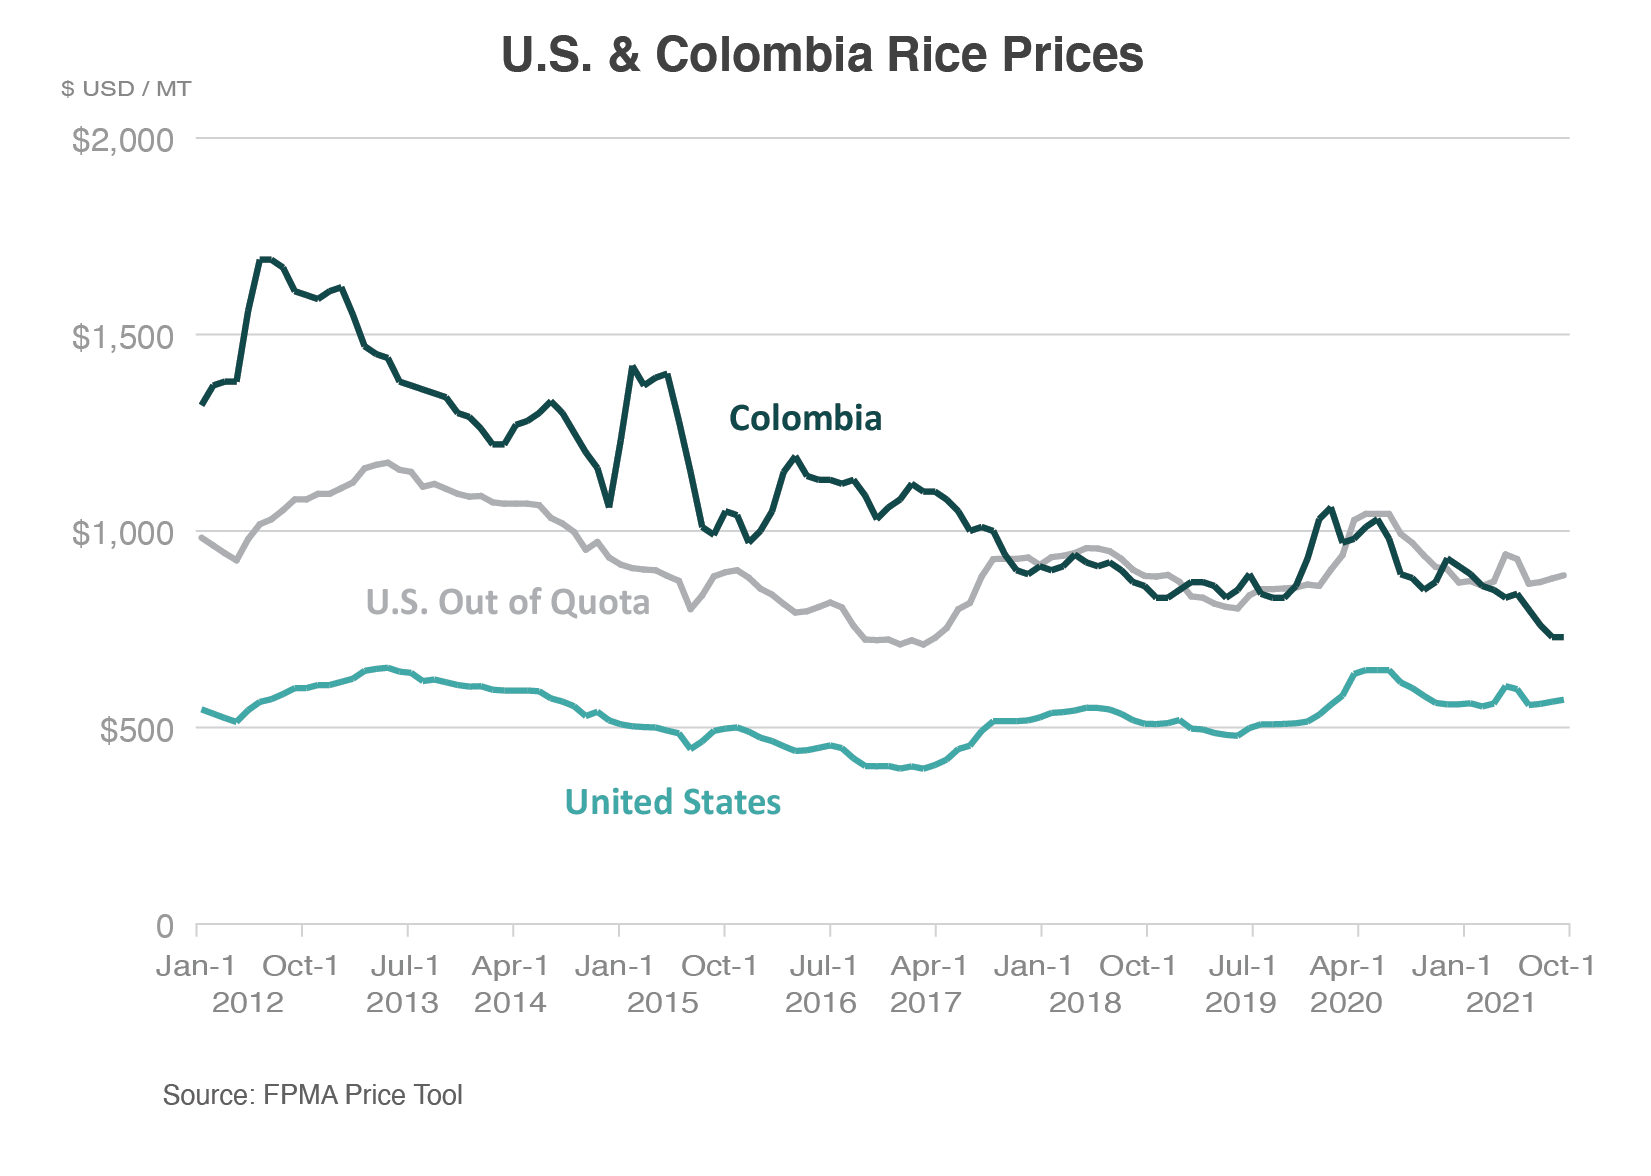
The price chart shows the differences between the Colombian national average retail prices for milled rice and the U.S. free on board (FOB) quotes for milled rice, with out-of-quota rates applied to the U.S. FOB milled rice export quotes based on the year. While U.S. exports to Colombia have been paddy rice exports, this gives the general sense of reduced competitiveness of U.S. rice in the market.
After the listed annual TRQ is filled, additional exports face tariffs listed in the chart. Despite the high tariff rates, U.S. rice has still been competitive for out of quota sales. However, Colombian domestic prices have trended downward over the past years and have begun to reach similar levels as the United States.
Not only have lower domestic prices in Colombia become a challenge to U.S. exporters, leading to unfilled quotas, but other competitors have also obtained duty-free access to the market due to their own free trade agreements with Colombia.
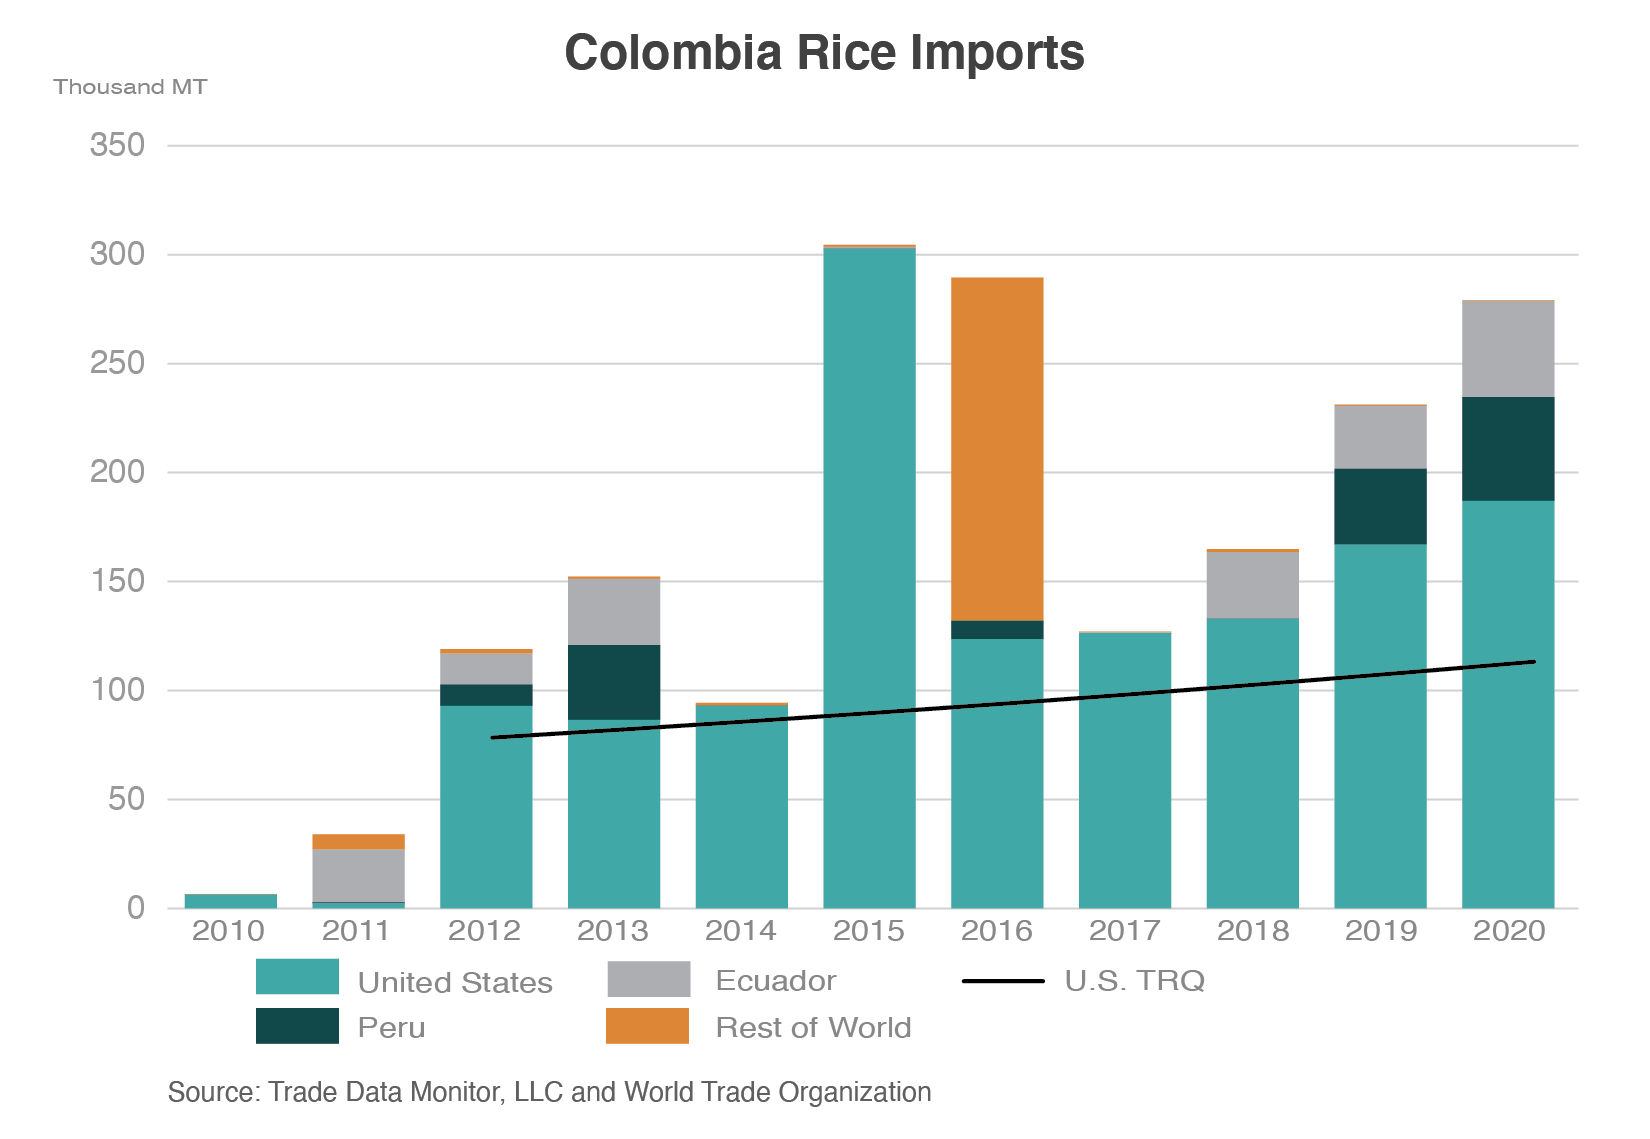
The most significant competitors for the United States are Peru and Ecuador. The two countries are members of the Andean Community of Nations (CAN),1 in addition to Colombia. Since 2018, CAN members have had access to a duty-free TRQ. Peru will have unlimited access in 2022 and Ecuador in 2027. U.S. market share has been decreasing over recent years as imports from CAN have grown. However, despite these gains, the United States still accounts for the largest share of Colombia rice imports. The exception was 2016, when Colombia imported rice from nontraditional suppliers due to severe impacts from El Niño.
In summary, Colombia has been a large market for U.S. rice, with exports increasing since the implementation of the TPA until recently; but it is currently not filling its TRQ with the United States. For the current April 2021-March 2022 harvest, a smaller crop is expected in Colombia, but large carryover stocks will continue to dampen import demand. Competition with other suppliers makes it challenging for the United States to boost sales. Even though the current 2021/22 USDA forecast assumes that Colombian imports will pick up pace towards to the end of the marketing year, prospects for U.S. sales this year remain highly uncertain.
1The group was initially referred to as the Andean Pact. The name changed in 1996 to the Andean Community (Comunidad Andina, CAN). This is a free trade bloc that trades in a wide variety of products, beyond rice. The full member countries are Colombia, Peru, Ecuador, and Bolivia.