U.S. Agricultural Exports to Cuba Have Substantial Room for Growth
Contact:
06-22-2015_cuba_iatr.pdf (103.5 KB)
Since the Trade Sanctions Reform and Export Enhancement Act (TSRA) was implemented in 2000, the United States has exported nearly $5 billion worth of agricultural products to Cuba. These exports have been supported by the close geographical proximity of the United States to Cuba and the island’s strong demand for U.S. agricultural products. The United States has typically been the largest supplier to Cuba and has had the highest market share of the island’s imports in nine out of the last 11 fiscal years. Recently, however, U.S. market share has declined due to increased competition, especially from countries able to provide export credits to the Cuban import authorities. But with the normalization of relations between the U.S. and Cuba now underway, potential reforms could help support U.S. competitiveness, increase total U.S. agricultural export value, improve U.S. market share, and benefit both U.S. exporters and Cuban consumers.
Agricultural Exports to Cuba
Under TSRA, agricultural products have been among the few goods allowed to be legally exported to Cuba under the longstanding U.S. embargo (medical supplies are the other exemption), and U.S. producers have taken advantage of that opportunity to the extent possible. Prior to the passage of TSRA in 2000, U.S. law had prevented sales of any agricultural commodities to Cuba since the early 1960s.
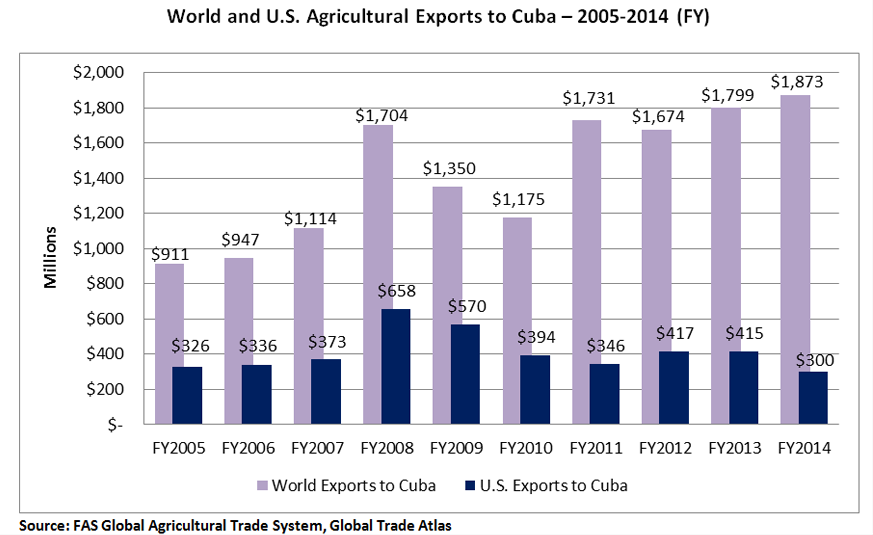
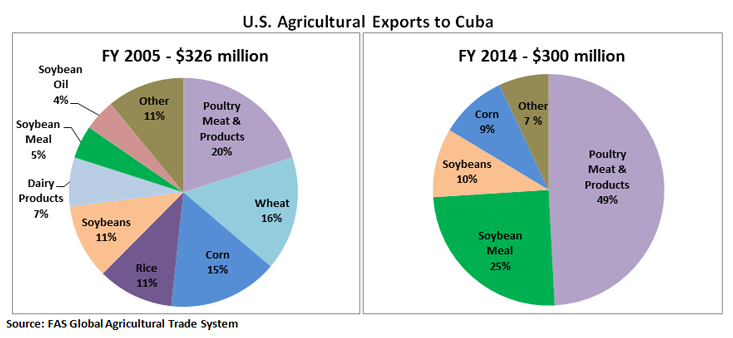
U.S. agricultural exports to Cuba totaled $300 million in FY 2014, comprising 16 percent of Cuba’s $1.9 billion in agricultural imports. U.S. exports included $148 million of poultry meat, making Cuba the eighth-largest export market for U.S. poultry. U.S. soybean meal shipments were the second-largest category, totaling $75 million in FY 2014. Together poultry and soybean meal accounted for nearly 75 percent of all U.S. agricultural exports to Cuba, up from just 25 percent a decade ago. Soybeans and corn, valued at nearly $30 million each, and feeds and fodders (including dried distillers grains), valued at $14 million, rounded out the top five agricultural export categories. Taken together, these five categories comprised 98 percent of U.S. agricultural exports to Cuba in FY 2014.
While U.S. agricultural exports to Cuba peaked at a record $658 million in FY 2008, the significant jump in value from the previous year was largely attributable to severe weather and high commodity prices. In 2008, Cuba was hit by three major hurricanes and two tropical storms that caused severe crop damage and necessitated a significant increase in imports. While high commodity prices drove U.S. agricultural export values up substantially in FY 2008, export volumes increased by only 11 percent. As commodity prices eased and Cuban agricultural production rebounded, U.S. exports returned to their pre-record levels but fell further in succeeding years due to competition from other suppliers.
The U.S. share of the Cuban market has slipped dramatically, from a high of 42 percent in FY 2009 to only 16 percent in FY 2014. The United States is now Cuba’s third-largest supplier, after the European Union and Brazil. U.S. exports have also become much less diversified, with poultry and soybean meal accounting for the lion’s share of trade last year. During the first six months of FY 2015, exports are down 40 percent compared to the same period the previous year, and have reached the lowest level since FY 2003.
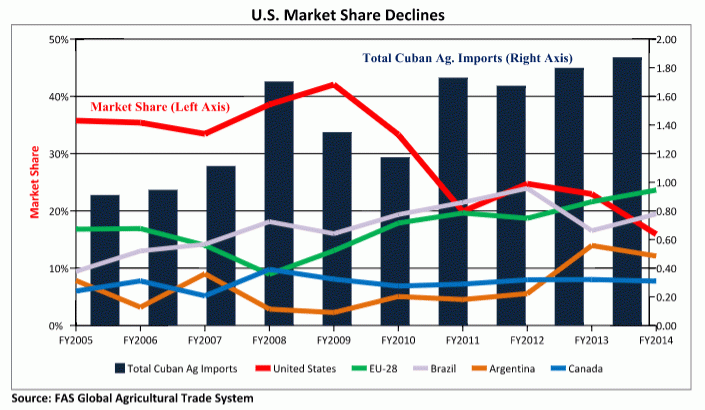
The recent decline in U.S. market share is largely attributable to a decrease in bulk commodity exports from the United States in light of favorable credit terms offered by key competitors. Under TSRA, U.S. exporters cannot offer terms of credit, and exports to Cuba must be purchased using cash or through third-party guarantees from foreign banks. Furthermore, there is a single Cuban government import entity, Alimport, that is responsible for all decisions regarding imports. Additionally, the Foreign Agricultural Service and other U.S. government agencies are barred from providing market development assistance, which is typically a key component of U.S. efforts to build trade capacity and boost export opportunities in other countries. Full liberalization of trade between the United States and Cuba would enable U.S. agricultural exports to compete on a more level playing field by allowing use of credit facilities, export and technical assistance, and market development programs.
While the United States was formerly Cuba’s dominant supplier of several bulk commodities, including wheat, corn, and rice, U.S. exports of these commodities have declined or, in the case of wheat and rice, disappeared. For wheat, the EU and Canada are now Cuba’s largest suppliers, with exports of $170 million and $67 million, respectively, last fiscal year. The United States once enjoyed a considerable market share, 43 percent as recently as FY 2009, but has not shipped wheat to Cuba since FY 2011.
For corn, Argentina and Brazil were the two largest exporters to Cuba in FY 2014, while the United States was third with exports valued at $28 million. The United States was Cuba’s largest corn supplier from FY 2002-2012. U.S. market share reached 64 percent in FY 2012 but has since declined to just 14 percent in FY 2014.
Cuba also imports significant amounts of rice and Vietnam and Brazil were the largest suppliers in FY 2014. In FY 2004, the United States supplied nearly 40 percent of Cuba’s rice imports. However, since FY 2009, Cuba has not imported rice from the United States.
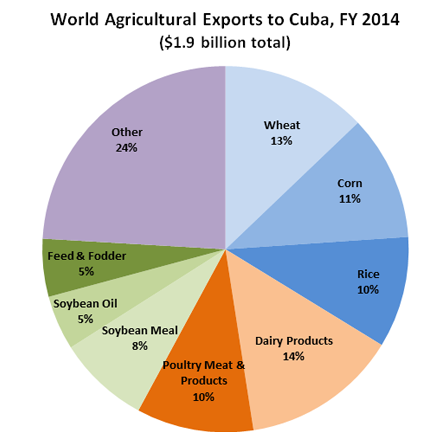
Cuba also imports significant amounts of consumer-oriented products, primarily dairy products and poultry meat. In FY 2014, those products accounted for 24 percent of Cuba’s total agricultural imports. The EU and New Zealand were the two largest suppliers of dairy products (predominantly powdered milk) last year, with exports totaling $106 million and $57 million, respectively. For poultry, the United States had a 77 percent share of the $200-million Cuban market in FY 2014, followed distantly by Brazil and Canada.
Intermediate goods such as soybean meal, soybean oil, and feed and fodder also represent a sizable portion of Cuba’s agricultural imports at 18 percent. Brazil is the dominant supplier of soybean oil, with exports worth $84 million last year. The United States was the largest exporter of soybean meal; and Argentina and Mexico were the top suppliers of feed and fodder with $43 million and $25 million in exports to Cuba, respectively, in FY 2014. Other goods imported by Cuba last year included pulses, valued at $57 million, primarily from China and Canada, and coffee from Brazil valued at $31 million.
Cuba Overview and Outlook
Cuba is the largest country in the Caribbean in terms of both area and population (at just over 11 million). According to IHS, Inc., which compiles data for the World Bank and the International Monetary Fund, Cuba’s gross domestic product will increase 2.7 percent in 2015, to $87.1 billion, and will continue to grow through 2021. The rising GDP will lead to higher incomes and an expanding middle class, which, in turn, will lead to increased consumption of meat, dairy products, and processed foods, of which the U.S. is a competitive supplier.
Tourism, one of Cuba’s top industries, will also play an important role in agricultural import demand. According to official Cuban statistics, nearly 3 million international tourists visited Cuba in 2014, up from 2.8 million in 2013, boosting demand for high-quality food and also creating local jobs.
Remittances (funds sent back to Cuba by Cubans living abroad) are estimated to be as high as $2 billion annually and are another driver of market growth. The loosening of U.S. remittance policy – with remittance limits quadrupled from $2,000 to $8,000 annually and remittances no longer restricted to immediate family members – will also increase the buying power of Cuban consumers, have a positive impact on market growth, and spur small business development.
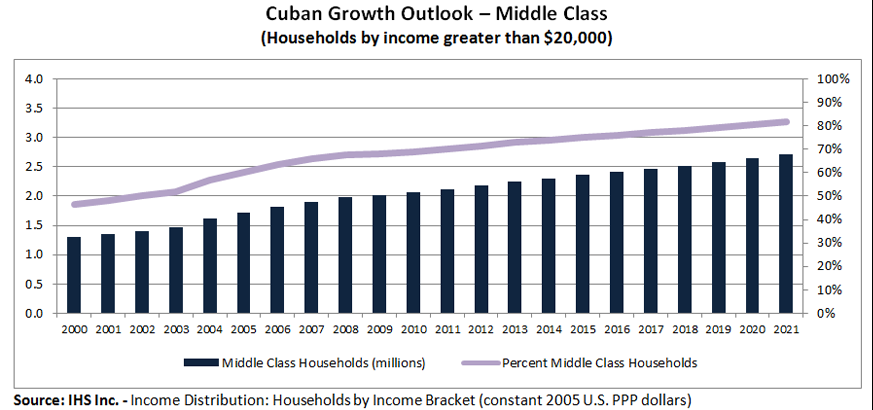
While there is potential for domestic agricultural production and development in Cuba, especially through greater access to inputs and foreign investment, Cuba is expected to continue to rely heavily on agricultural imports. Outside of the sugar industry, Cuban agricultural production is stagnant, with a production shortfall covered by nearly $1.9 billion in agricultural imports in FY 2014. Imports account for 60-80 percent of Cubans’ caloric consumption.
The United States has huge structural advantages in exporting to Cuba. Chief among them is location. The United States is less than 100 miles away, meaning lower shipping costs and transit times, especially when compared to current top competitors, the EU and Brazil. This is strategically advantageous for the United States since bulk commodities and highly perishable agricultural products can be shipped to Cuba in manageable quantities, overcoming storage and other infrastructure limitations.
Both USDA analysis and a study conducted out by Texas A&M University for the American Farm Bureau Federation indicate that the full liberalization of trade with Cuba would create new opportunities for U.S. agricultural exports. The lifting of restrictions on travel and capital flow, and the ability for USDA to conduct market development and credit guarantee programs in Cuba, would enhance U.S. export competitiveness, drive Cuban demand for U.S. agricultural products, and halp the U.S. recapture market share.
