
Peaches and Nectarines: Global Growth in Production Slowing While Exports Plateau
Contact:
Link to report:
Summary
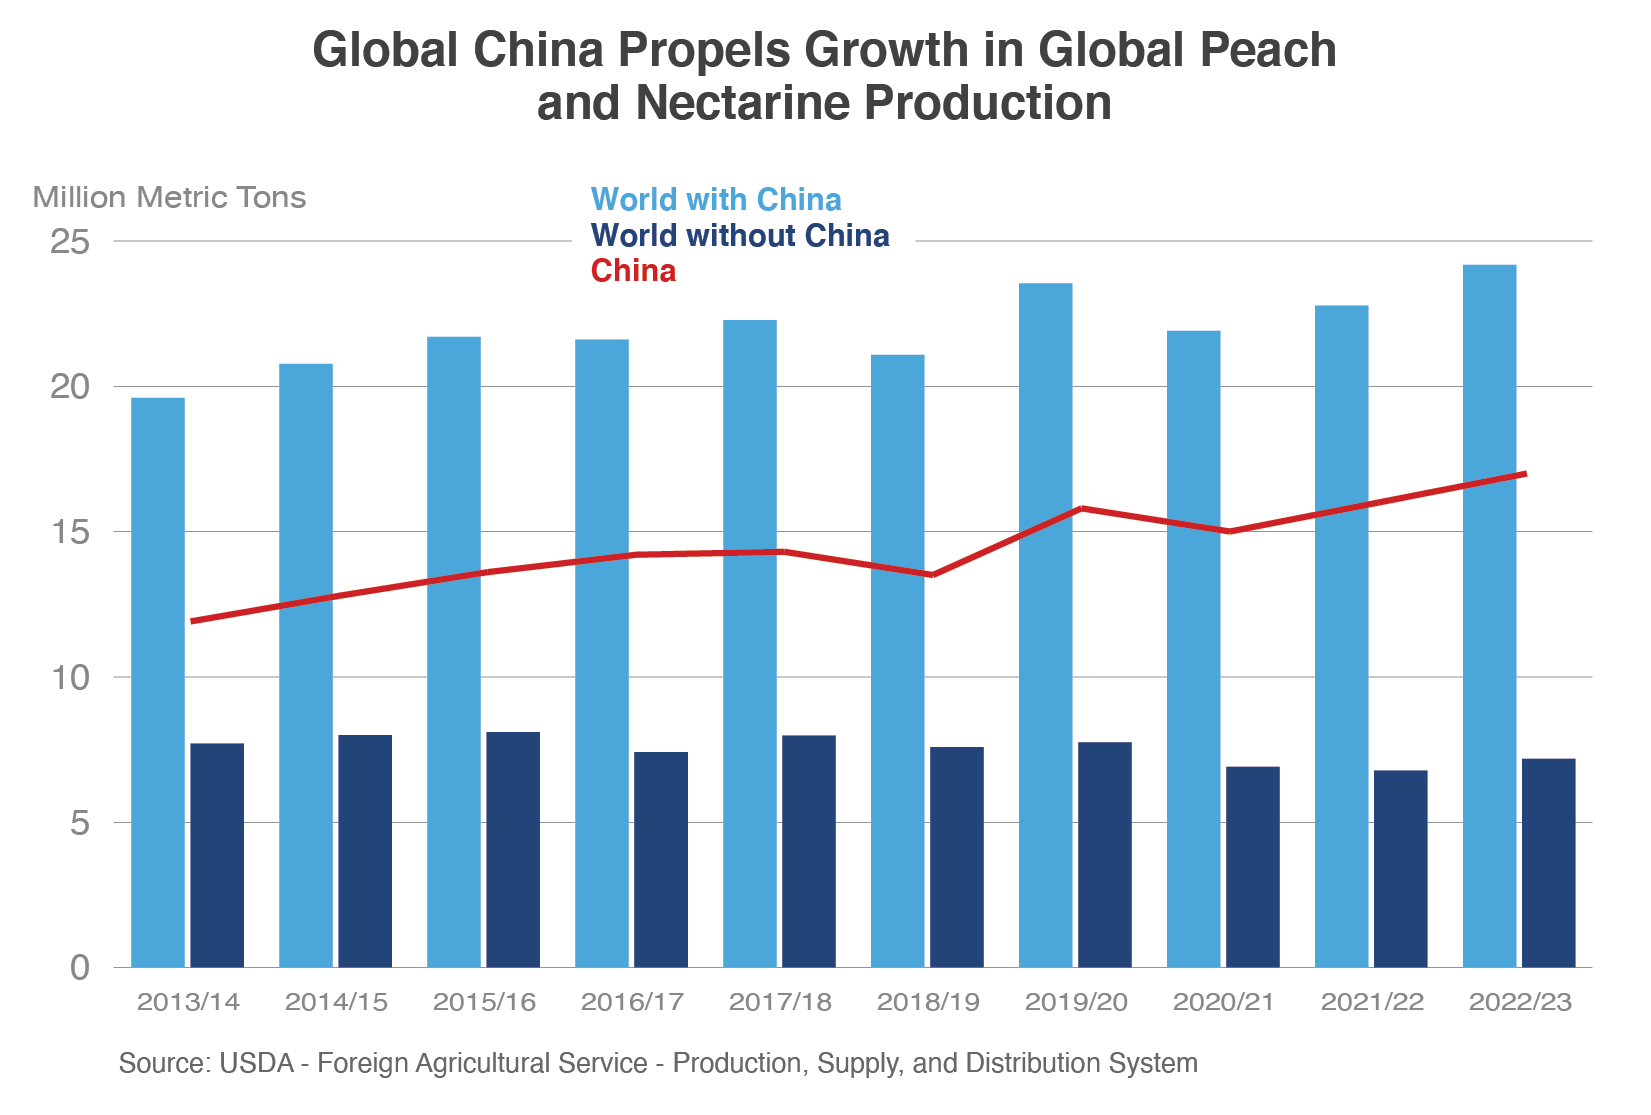
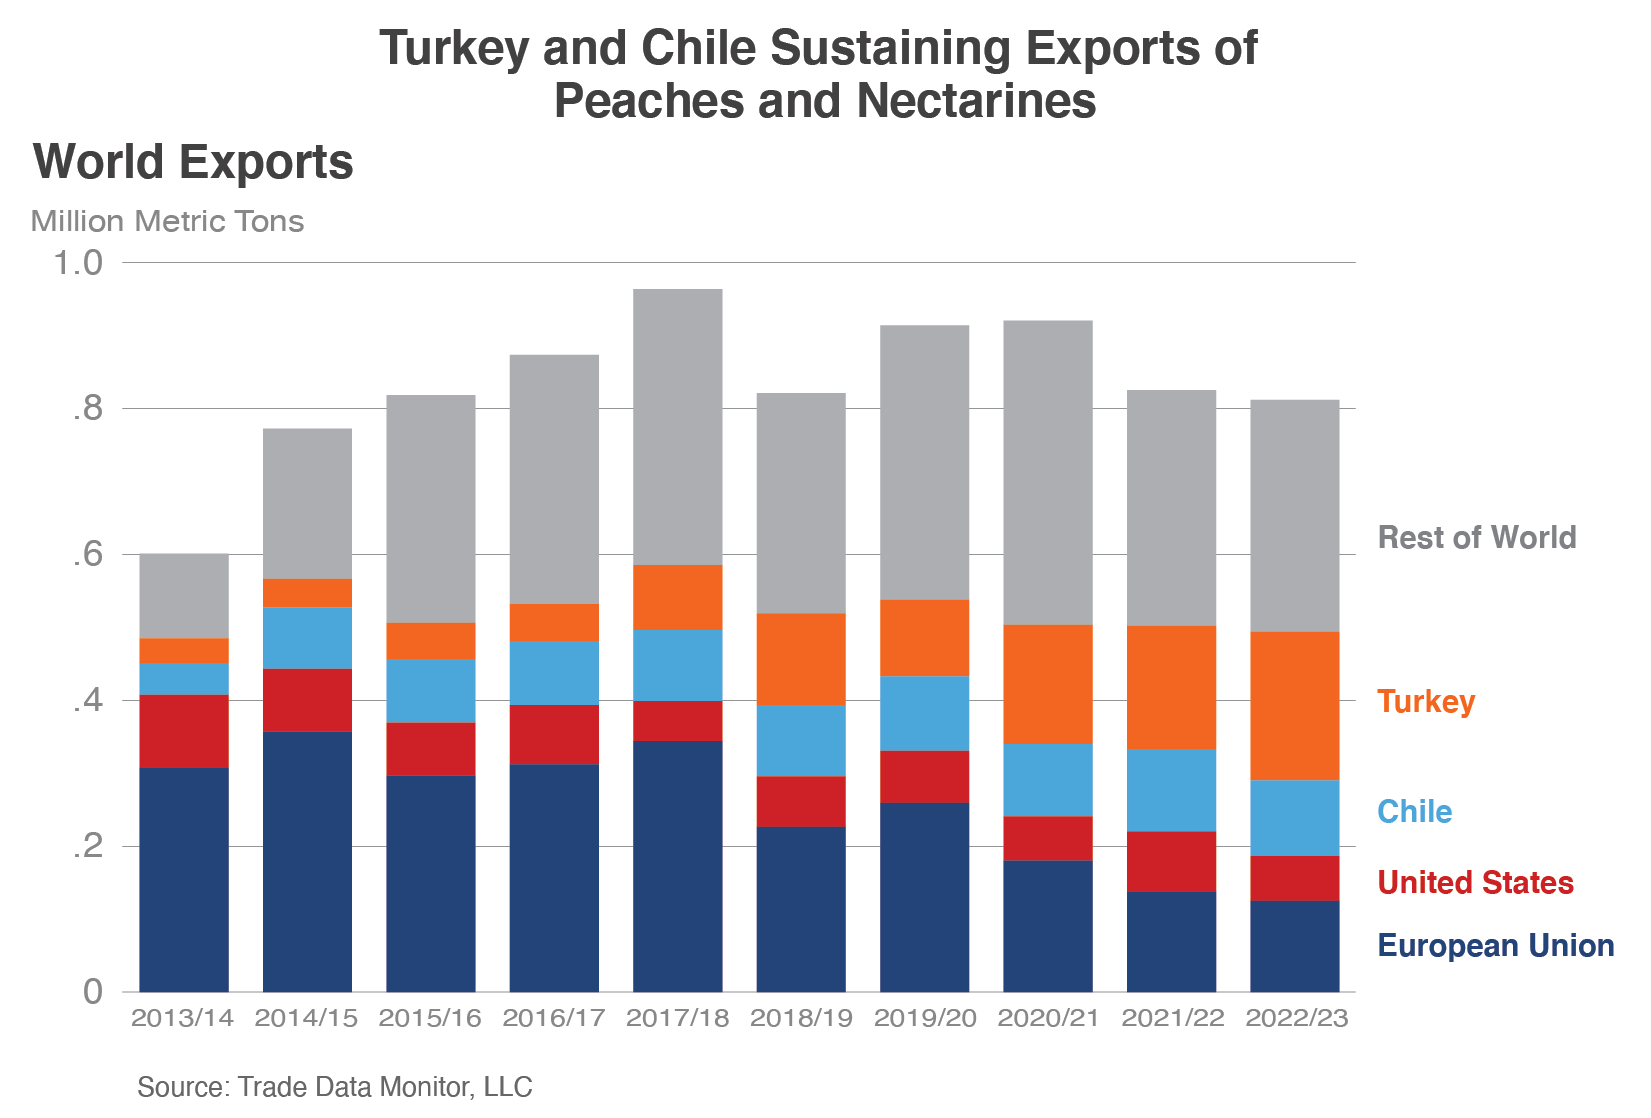
World peach and nectarine1 production has seen significant growth in the past decade, rising more than 20 percent from 19.6 million tons to 24.2 million in 2022/23. On the surface, this appears to be a growth industry; however, more countries have declined in production than grown since 2013/14, including declines in the European Union and the United States, both of which are considered to be among the top-five producers. Turkey and Chile contributed to global growth, but the upward trend globally has been overwhelmingly due to expansion in China, with China gains more than offsetting the total combined losses from the rest of the world. However, steady global production gains have not contributed to growing trade because production in China is mostly consumed domestically. Global exports have risen 35 percent since 2013/14 but peaked in 2017/18 and have since leveled off at reduced levels.
China Expansion Drives Global Production
China has been the world’s largest peach and nectarine producer dating back to at least 2001/02, when output stood at 4.6 million tons, edging out the European Union which produced 4.0 million. China’s output since then has nearly quadrupled to 17.0 million tons in 2022/23 and now accounts for 70 percent of world production. Acreage saw annual increases between 2008/09 and 2019/20, with most of the production occurring in central China. Slight annual declines since then have been partially triggered by poor economic returns, prompting growers to remove trees or transition to more profitable crops. Additionally, in major grain producing provinces, the People’s Republic of China (PRC) is encouraging or requiring fruit producers to remove orchards grown on farmland (as defined by PRC regulations). According to guidelines released by the PRC’s State Council on grain production, farmland should primarily be used for grains, cotton, oilseeds, sugar, vegetables, and forages.2 Peach and nectarine acreage is declining in northern and central China but rising in the more hilly and mountainous western provinces with the ongoing removal of orchards from farmland. Most acreage is held by small-scale family farms of less than one hectare, but farms are consolidating which is expected to lower costs and improve quality. Despite recent years of acreage declines, trees continue to come into full production, so far sustaining a trend since 2001/02 of average annual output gains of more than 500,000 tons.
Turkey’s production success has been more modest than China’s, but just as relentless with near-constant annual growth during the past decade as investments in orchard improvements continue to be spurred by demand in export markets and the domestic juice industry. Growers are converting older peach and nectarine orchards to high density orchards planted with new varieties and root stock. They are also adopting modern growing techniques, including tree training systems that support and guide tree growth. These enhancements have improved quality and yield, boosting combined peach and nectarine output by nearly 60 percent since 2013/14 to a record 1.0 million tons in 2022/23. Acreage has also risen due to increased plantings of nectarine trees. Planted area for peaches has remained fairly constant, but nectarine acreage has nearly tripled since 2013/14, reflecting a growth in consumer preferences for nectarines in both domestic and foreign markets.
Chile production has risen almost 80 percent since 2013/14 to an estimated 160,0003 tons on growth in nectarines. Peach acreage has steadily declined, particularly for canning peaches, but greater returns for nectarines is spurring investments in nectarine plantings, mostly offsetting lost peach acreage. Chile is estimated to be the third largest producer among Southern Hemisphere producers and has shown the most growth.
In contrast to China, Turkey, and Chile, the European Union and United States have seen production shrink during the past decade due to a combination of declining demand and weather damage.
The European Union maintained an average output of 4.0 million tons per year through 2019/20, but the following year saw production drop more than 20 percent from 4.1 million tons to 3.2 million. Production through 2022/23 remained below 4.0 million tons, as damaging rain and frost each year impacted yield, especially in the top growing member state Spain, which accounts for 40 percent of EU production. Total EU acreage contracted during the past decade with almost yearly declines and more rapid reductions the past 5 years. More than 90 percent of EU production is consumed domestically, however over-supply and poor returns for EU growers have prompted tree removals in top growers Spain and Italy. The EU’s share of global production fell from 19 percent in 2013/14 to 13 percent in 2022/23.
In the United States, production4 has declined at an even greater rate during the past decade, down more than 30 percent as volumes dropped more than 300,000 tons to 650,000. Output in almost all growing states has slipped, but the most significant decline has been in California, where combined peach and nectarine production has fallen more than 200,000 tons since 2013/14. California is the top growing state, accounting for 80 percent of U.S. output, and nearly 100 percent of peaches for processing. Declining demand for processing peaches has driven a 43-percent drop in Clingstone peach production since 2013/14 as U.S. consumption of canned peaches dropped 35 percent between 2013/14 and 2021/225. Used almost exclusively for processing, 2022/23 saw Clingstone’s share of California production decline for a fourth straight year, with volumes falling less than 200,000 tons for the first time since at least 2002/03. Output of California Freestone peaches also declined over the past decade, contracting 6 percent to 238,000 tons. Although consumed mostly as fresh, an average of one-third of Freestone supplies go to processing. California’s nectarine production also dropped significantly, falling 30 percent since 2013/14. While acreage steadily declined, 2022/23 crop losses from weather damage helped push output less than 100,000 tons for the first time since the early 1970s.
Global Exports Up but Not Due to China
As with production, world exports have experienced significant growth during the past decade, rising more than 30 percent and averaging more than $1 billion per year. However, the growth trend has leveled off recently as export volume slipped and then plateaued during the past 5 years. Though China dominates global supplies, increased output has not translated into significantly greater exports, but has instead boosted domestic consumption. China’s shipments of fresh peaches and nectarines during the past two years were below the 10-year average of 73,000 tons, and canned peaches have remained nearly flat. In addition, the European Union and the United States – leading exporters – have experienced significant reductions following shrinking production. Export growth has instead been greatly driven by output gains in Turkey and Chile, helping to lift global exports to a record 964,000 tons in 2017/18 and sustaining exports between 820,000 and 920,000 tons since then.
The European Union had historically been the key driver of global trade, accounting for half of global exports in 2013/14. EU exports have fallen from 180,000 tons to 125,000 since then, and the global market share was reduced to 15 percent. Traditionally a net exporter, declining supplies in Spain continue to narrow the EU trade balance as exports have remained less than 150,000 tons since 2021/22. Russia was the top market for EU exports until 2014/15, followed by Belarus through 2017/18, and now the United Kingdom receives most of EU shipments, though also at shrinking volumes.
U.S. exports also experienced significant declines. Falling from 100,000 tons to 61,000 throughout the past decade, the U.S. world market share declined from 17 to 8 percent. Canada and Mexico remained the top markets with a rising level of importance as combined shipments increased from 67 to 87 percent of total U.S. exports in 2022/23. Taiwan is the third largest market but dwindling in importance as shipments eroded from 22 to 7 percent of total U.S. exports. The United States is Taiwan’s dominant supplier, but Taiwanese consumer demand from Northern Hemisphere suppliers is declining as fruit consumption is becoming increasingly diversified and imports compete with a large supply of less expensive, locally produced fruit.
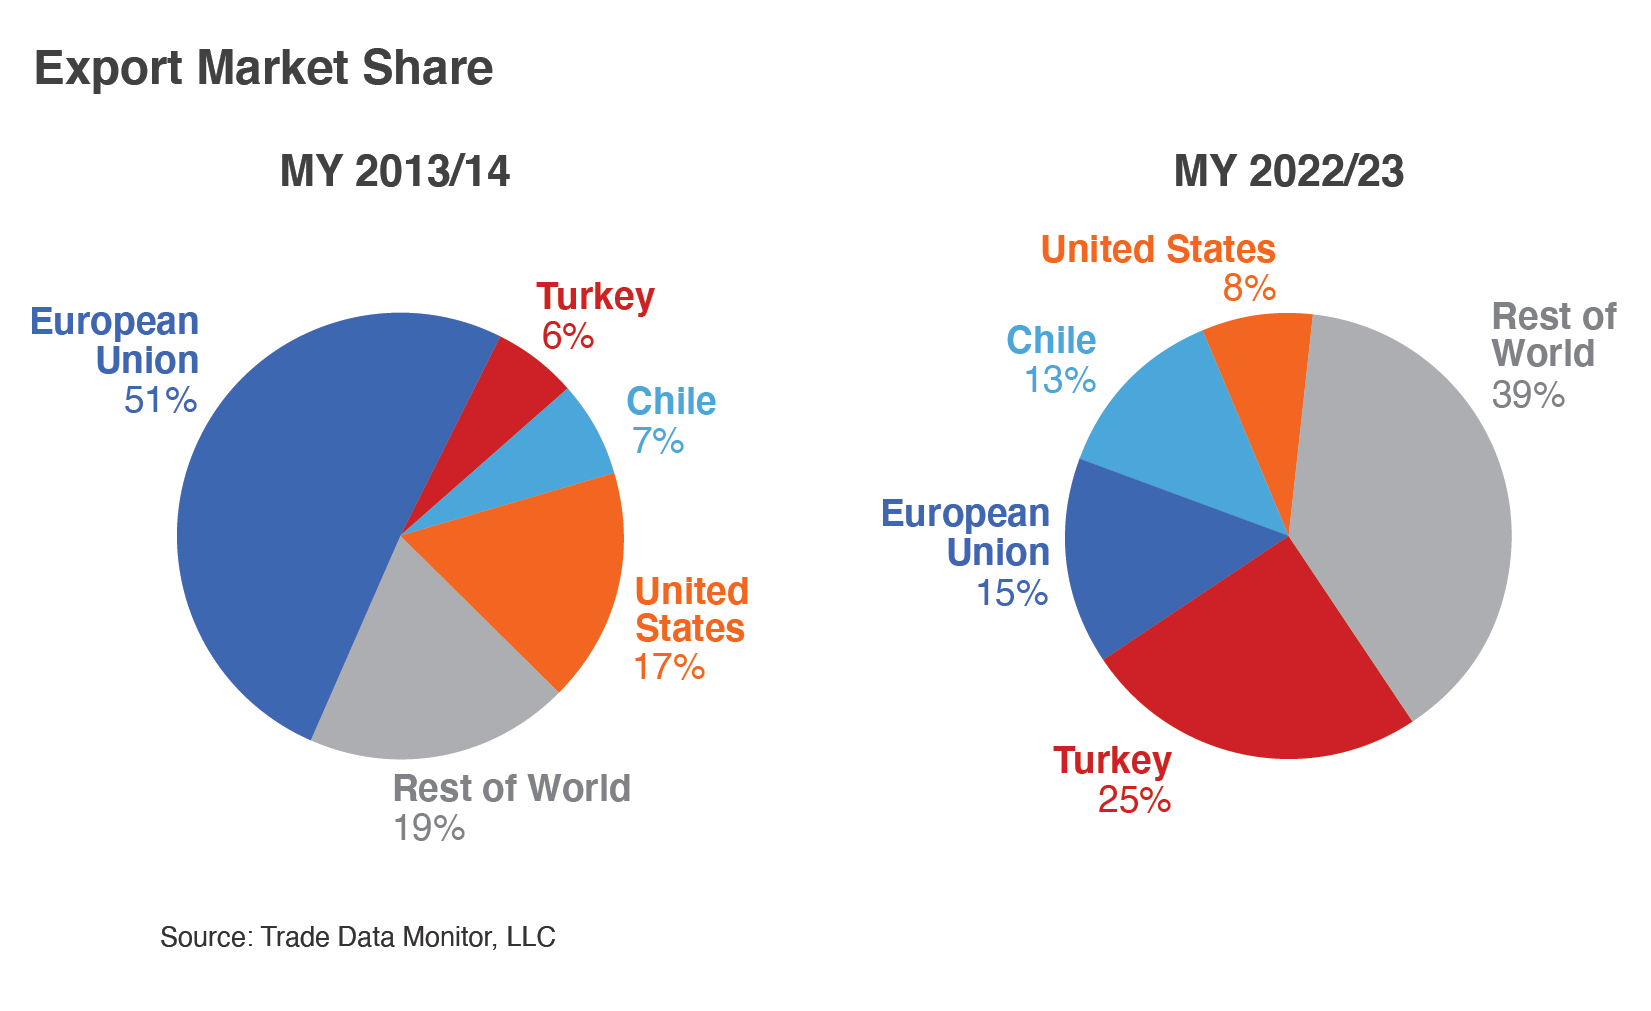
While EU and U.S. supplies slumped, investments in Turkey were bearing fruit. Improved quality has boosted demand, combined with more available supplies, Turkey exports surpassed the European Union to become the world’s top exporter in 2021/22, rising five-fold to a record 170,000 tons. Shipments of peaches alone have nearly quadrupled during the past decade while nectarines have risen nearly seven-fold, almost equaling peach export volumes. Russia is the top market by a large margin, receiving at least 70 percent of peach and nectarine shipments during the past four years. Turkey also expanded their global presence, exporting to almost 60 markets around the world. Turkey accounted for a quarter of global exports in 2022.
Chile is a growing player in the global nectarine trade as the world’s third largest peach and nectarine exporter and the leading Southern Hemisphere supplier. With a growing season counter-cyclical to most of the top exporters, Chile is mostly unchallenged in export markets (by either competitor suppliers or domestic supplies). Shipments have also more than doubled since 2013/14 to an estimated 104,000 tons. Nectarines accounted for most of the growth through 2021/22. Exporting more than 60 percent of their combined peach and nectarine production, Chile’s share of global exports has nearly doubled since 2013/14. The United States was their top market until 2020/21, but Chile gained market access to China for nectarines in 2017. This triggered a rising flow of shipments to China that made them Chile’s top export market in 2021/22 at 37,000 tons.
Future Not So Peachy
Growth in the global peach and nectarine production has been supported overwhelmingly by China since 2001/02, but declining acreage in China could mark the start of an easing of global output in the not-too-distant future. Without China’s gains during the past decade, global production would have fallen over 500,000 tons. Although Turkey and Chile have increased output and boosted world exports, their production growth has been at a much slower pace. While global exports plateaued in the past two years, it remains to be seen if Turkey and Chile will be able to continue providing sufficient supplies to counter future reductions in output among other leading exporters
1 Peaches and nectarines are both included in HS-6 code 080930 and are harmonized only to this level. Unless otherwise indicated, all data is inclusive of both peaches and nectarines.
2 See FAS/GAIN report CH2023-0103
3 Data for Chile’s 2022/23 marketing year is not yet final.
4 USDA/National Agricultural Statistics Service
5 USDA/Economic Research Service
Market share and global trade information is from Trade Data Monitor, LLC, unless otherwise indicated.