Agricultural Exports to the European Union: Opportunities and Challenges
Contact:
Summary
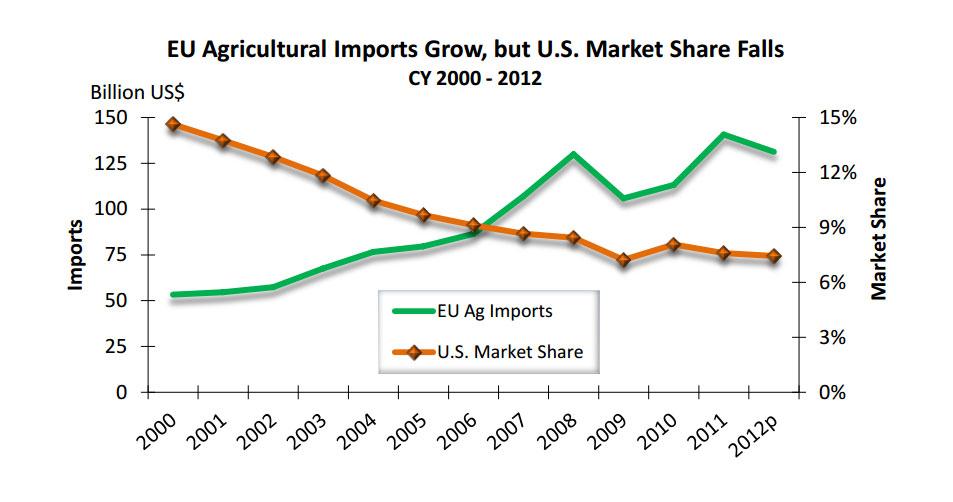
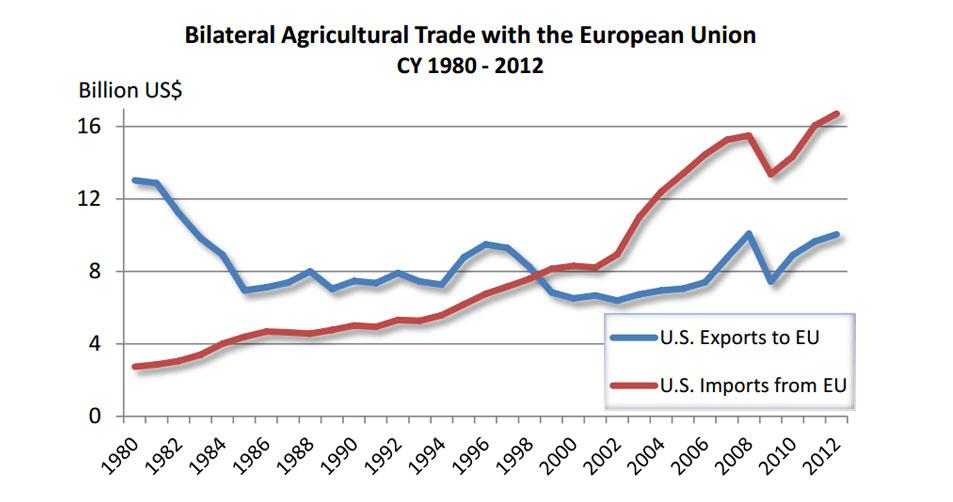
The European Union (EU) is the world’s largest import market for agricultural commodities and food. From calendar year 2000 to 2012, EU agricultural imports increased by an estimated 145 percent, from $53.3 billion to more than $131 billion. However, U.S. agricultural exports to the EU have vastly underperformed compared to the overall growth in U.S. agricultural exports to the world. Since 2000, global U.S. agricultural exports have increased 176 percent while exports to the EU have increased only 54 percent. Though U.S. exports to the EU rebounded in 2012 to $10.1 billion, they remain below the record level achieved in 1980. The ability of U.S. agricultural and food exporters to penetrate this growing market is constrained by tariff and nontariff trade barriers in combination with increased global competition.
U.S. Exporters Lose Market Share as EU Market Grows and Competition Intensifies
As EU agricultural imports have grown, U.S. market share has steadily declined to just 7 percent – half of the level achieved in 2000. While they were once the top market for U.S. agricultural exports, the 27 current EU members now rank as the fifth-largest market for U.S. agricultural exports. At $10.1 billion in 2012, U.S. agricultural exports to the EU were $3.4 billion less than exports to Japan, our fourth-largest market, and nearly $16 billion less than exports to China, our top market. The 2012 total of $10.1 billion is also considerably less than the record $13 billion to these same 27 countries achieved in 1980. When adjusted for inflation, the value of trade in 1980 was more than $36 billion in 2012 dollars, further illustrating the significance of the drop-off in trade.

Much of the loss in U.S. market share is due to unfavorable market developments in soybeans, feeds and fodders, tobacco, and some high-value, consumer-oriented products. Over the past decade, Brazil has overtaken the United States as the top supplier to the EU and, in 2012, Brazil’s market share was estimated to be nearly double that of the United States. Much of the increase in Brazilian exports is due to greater soybean and soybean meal shipments, which have grown much faster than U.S shipments. Over the past decade, China and Chile have also increased market share in the EU, due in part to greater fruit and vegetable exports. Exports from the Ukraine have also surged, from less than half a billion dollars in 2000 to nearly $5 billion in 2012, as grain, rapeseed, and sunflower oil shipments have accelerated.
The Changing Composition of U.S. Agricultural Exports to the EU
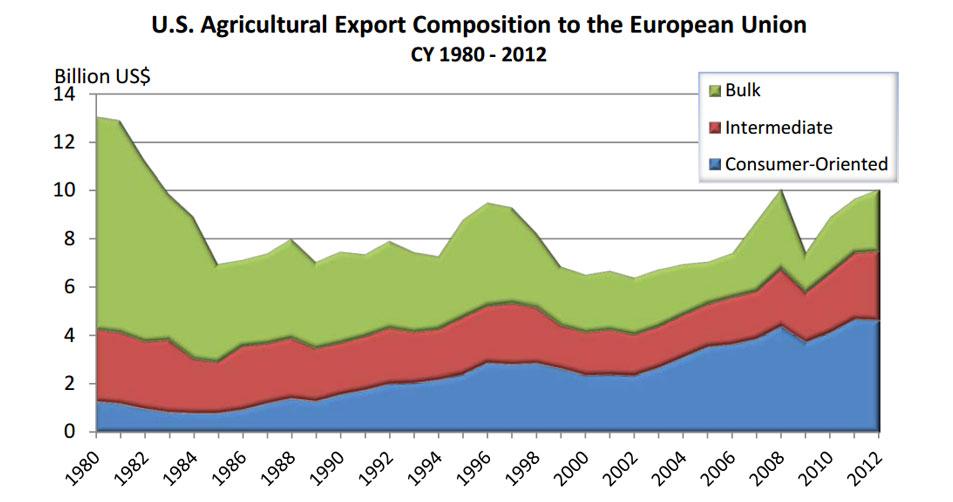
The composition of U.S. agricultural exports to the EU has changed significantly over the last three decades with some of the biggest changes occurring as a result of trade restrictions on bulk commodities. For instance, corn and soybeans together accounted for 48 percent of total U.S. agricultural exports to the EU in 1980, but were only 15 percent in 2012. Non-tariff barriers and regulatory policies, along with other market developments, contributed to this decline. The Ukraine is now the largest supplier of corn to the EU market and Brazil is the largest supplier of soybeans. Some of the losses in bulk export sales have been partially offset by increases in exports of high-value, consumer-oriented products. Most notably, exports of tree nuts have soared from $381 million in 1980 to more than $1.7 billion in 2012. However, some products in the consumer-oriented category, particularly beef and poultry, still face significant trade barriers, which seriously constrain or restrict trade.

Bioenergy Exports Increase but Still Face Restrictions
In contrast to traditional agricultural products, U.S. bioenergy exports to the EU have generally outpaced other agricultural commodities over the last five years. U.S. exports of ethanol have increased by more than 730 percent, to $458 million, and now account for 37 percent of all EU ethanol imports. Similarly, EU imports of U.S. wood pellets and wood chips are up more than 733 percent, by value, to $246 million. Meanwhile, U.S. biodiesel exports have fallen 72 percent due to EU antidumping and countervailing duties imposed in 2009. The expiration of the duties, scheduled for 2014, may boost U.S. biodiesel exports. Conversely, the possibility of a 9.6 percent antidumping duty looms for ethanol. EU member states have until the end of February to ratify the proposed antidumping duty, which, if approved, could price U.S. ethanol out of the EU market.
Other non-tariff barriers, such as sustainability criteria and caps on first-generation biofuels in an attempt to limit indirect land use change, have the potential to hamper ethanol and biodiesel trade between the EU and the United States. The EU’s flagship biofuels legislation, the Renewable Energy Directive (RED), requires biofuels to meet certain sustainability criteria to qualify for tax incentives and count toward use mandates. The criteria include a mass balance/traceability requirement for biofuel feedstocks such as soybeans, corn, and canola. The paperwork and auditing necessary to meet the requirements add significant cost and liability to marketing U.S. agricultural commodities in the EU. The EU is currently considering similar legislation for wood pellets and chips.
U.S. Agricultural Imports from the EU Soar, Trade Deficit Increases
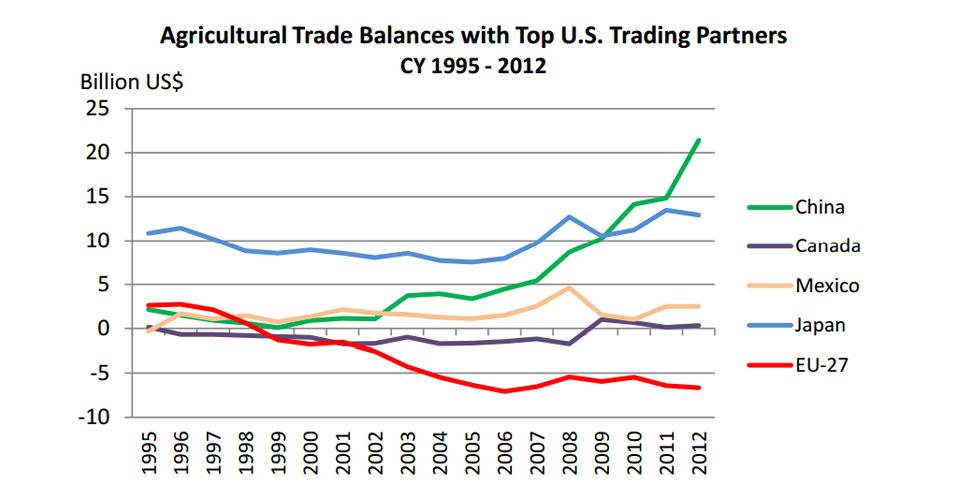
While the United States has lost ground as a supplier to the EU market, we remain their top customer for agricultural products. U.S. agricultural imports from the EU reached a record $16.7 billion in 2012, up 4 percent from 2011. Top products included wine and beer, essential oils, and snack foods. At $6.7 billion in 2012, the U.S. agricultural trade deficit with the EU is the largest of any trading partner and contrasts sharply with that of other major U.S. trading partners.


Conclusion
While EU imports of agricultural commodities, food, and bioenergy increased greatly from 2000 to 2012, U.S. agricultural exports to the EU vastly underperformed as compared to the overall growth in U.S. agricultural exports to the world. The ability of U.S. agricultural, food, and bioenergy exporters to take full advantage of this growing market is constrained by tariff and non-tariff barriers in combination with increased global competition. These constraints to U.S. exports, and steadily increasing EU imports, have led to the largest U.S. agricultural trade deficit with any trading partner. This trade dynamic contrasts sharply with the experiences of other major U.S. trading partners who remain balanced, as in the case of Canada, or shifted to surplus such as China, Japan and Mexico.
