
Trade Opportunities in Southeast Asia: Indonesia, Malaysia, and the Philippines
Contact:
Printer-Friendly PDF (213.66 KB)
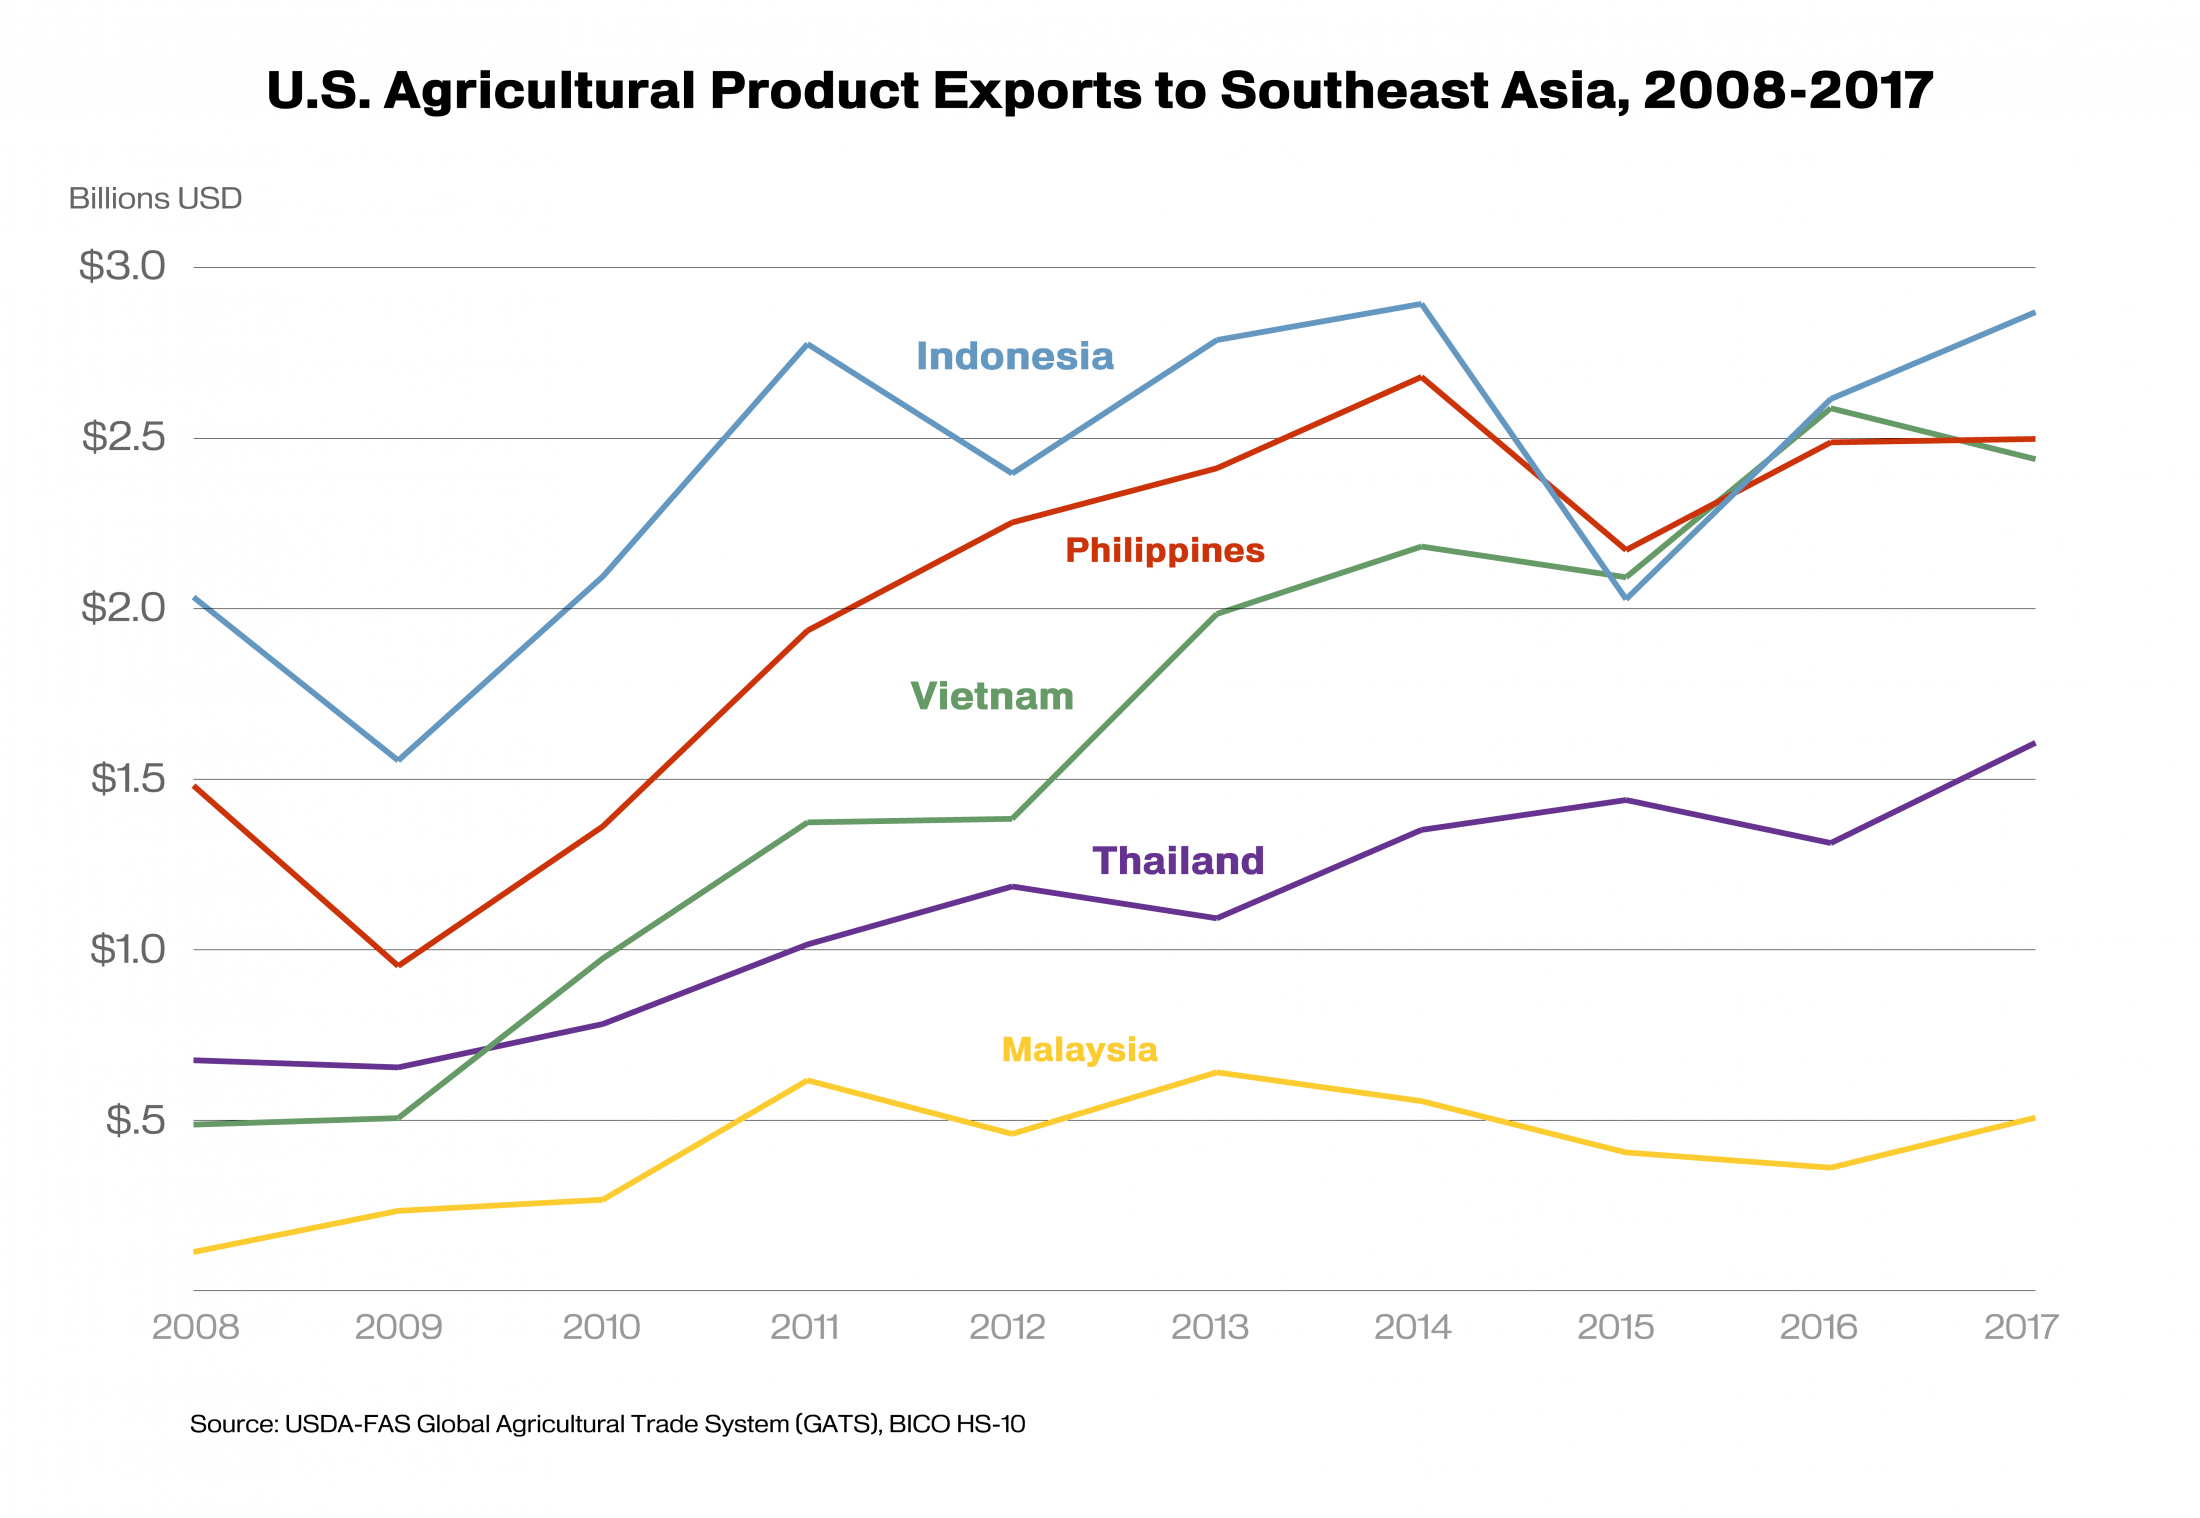
Southeast Asiai is a major market for U.S. agricultural products, ranking as the third-largest regional market in 2017, behind East Asia and North America. U.S. exports to Southeast Asia have grown quickly over the last decade, with sales of farm and food products totaling nearly $11.8 billion in 2017, representing a 68-percent increase since 2008. With a collective population of more than 641 million and agricultural imports exceeding $91 billion a year, Southeast Asia promises to remain a substantial market for U.S. agricultural exports.
Indonesia, Malaysia, and the Philippines, are among the region’s high-growth import markets for agricultural products, accounting for nearly 55 percent ($6.4 billion) of U.S. agricultural exports to Southeast Asia in 2017. Other fast-growing markets in the region are Vietnam and Thailand, which together accounted for more than half of all U.S. agricultural export growth to the region since 2008.
The diets of Southeast Asia’s citizens are changing as the region’s growing middle class becomes more urbanized and consumers demand more high-value and healthy food products. Increasing demand, coupled with the region’s economic stability, means there are solid growth opportunities for U.S. consumer-oriented products in the region, building on an export market that has traditionally been dominated by U.S. bulk products.
In 2017, U.S. agricultural exports to Southeast Asia had a 13-percent market share, second only to China. U.S. sales are strongest in the bulk category, including soybeans, cotton, and wheat. High demand for bulk products has largely been driven by the region’s rapidly expanding poultry, aquaculture, and textile industries, as well as by growing food demand, especially in Indonesia.
Halal certification is required by Indonesia and Malaysia and, therefore, prospects for U.S. export growth to these markets hinge on the continued recognition of third-party, U.S.-based halal certifiers who verify adherence to halal standards and issue a certificate for every shipment. This is particularly true for meat and dairy products, but can also include various processed products.
Indonesia Overview and Outlook
| Top Five U.S. Agricultural Exports to Indonesia | |||||||
| Product | Values in Million USD | U.S. Market Share 2017 | U.S. Rank Among Suppliers | ||||
| 2013 | 2014 | 2015 | 2016 | 2017 | |||
| Total Agricultural Exports | 2,823.2 | 2,911.7 | 2,190.1 | 2,679.6 | 2,892.6 | 17% | 1 |
| Soybeans | 983.8 | 1,030.0 | 772.9 | 989.4 | 922.1 | 98% | 1 |
| Cotton | 287.6 | 325.7 | 295.3 | 346.0 | 501.6 | 41% | 1 |
| Wheat | 213.5 | 260.9 | 105.2 | 192.2 | 290.8 | 11% | 4 |
| Feeds & Fodders | 334.6 | 276.1 | 219.5 | 263.9 | 253.3 | 54% | 1 |
| Dairy Products | 315.8 | 274.9 | 183.0 | 158.3 | 133.1 | 12% | 3 |
| Source: USDA FAS GATS-BICO HS-10; market share data derived from IHS Markit | |||||||
Indonesia is the most populous country in Southeast Asia, with 263 million people in 2017.ii The World Bank identifies it as an emerging middle-income country, with the number of middle class1 households forecast to rise from 28 million in 2016 to 42 million in 2021. Real purchasing power parity gross domestic product (PPPiii GDP) per capita was $11,498 in 2017 and real GDP growth has averaged around 5 percent annually.
Indonesia’s overall economic growth, along with a sizable young population, rapid urbanization, and concerns about heath and food safety are driving changes in consumption patterns towards high-value, health and wellness products. According to Euromonitor, spending on food and non-alcoholic beverages grew at an annual rate of 13.8 percent from 2010 to 2015, reaching $629.1 per capita in 2015. This amount is forecast to increase 20.7 percent by 2020 to reach a value of $759.4 per capita.
As Indonesia’s retail sector and consumer purchasing power continue to grow, demand for high-quality fresh produce and western food products are expected to increase. The ongoing expansion of modern shopping centers to smaller cities and regions outside of Java will boost sales in the food service sector, promising opportunities for U.S. food and agricultural exports.
In 2017, U.S. agricultural exports to Indonesia totaled nearly $2.9 billion, an 8-percent increase from 2016. Top U.S. agricultural exports to Indonesia include soybeans, cotton, wheat, feeds and fodder, and dairy products. In addition, growing interest in health and wellness products points to strong opportunities for exports of fresh fruits and tree nuts and processed fruit and vegetable products. Top U.S. competitors in the Indonesian market are Australia, China, Thailand, and Brazil.
Philippines Overview and Outlook
| Top Five U.S. Agricultural Exports to the Philippines | |||||||
| Product | Values in Million USD | U.S. Market Share 2017 | U.S. Rank Among Suppliers | ||||
| 2013 | 2014 | 2015 | 2016 | 2017 | |||
| Total Agricultural Exports | 2,509.9 | 2,733.1 | 2,310.2 | 2,573.5 | 2,591.7 | 22% | 1 |
| Soybean Meal | 604.8 | 585.2 | 634.6 | 729.6 | 747.4 | 76% | 1 |
| Wheat | 627.4 | 697.9 | 516.1 | 591.9 | 564.9 | 51% | 1 |
| Dairy Products | 364.0 | 421.5 | 251.3 | 226.9 | 243.3 | 20% | 3 |
| Pork & Pork Products | 112.3 | 103.5 | 79.5 | 78.9 | 97.5 | 16% | 2 |
| Soybeans | 23.9 | 56.2 | 47.4 | 104.1 | 92.9 | 93% | 1 |
| Source: USDA FAS GATS-BICO HS-10; market share data derived from IHS Markit | |||||||
The Philippines is one of the fastest-growing economies in Asia. The World Bank identifies the Philippines as a dynamic economy, rooted in strong consumer demand and supported by improving real incomes and robust remittances. The Philippines’ real PPP GDP per capita growth rate was a strong 5.1 percent in 2017, while middle class households are forecast to rise from 6 million in 2016 to 10 million in 2021.
With one-fifth of the population earning an average annual income of $12,510 (about four times the annual per capita GDP of $3,000), the Philippines has a strong and growing consumer base with increasingly sophisticated tastes and growing access to supermarkets. The country’s robust economy, coupled with this young, fast-growing, highly urbanized population, presents significant opportunities for U.S. exporters of processed foods and beverages and high-value agricultural ingredients.
U.S. food and agricultural exports to the Philippines totaled nearly $2.6 billion in 2017, an increase of 1 percent from 2016. Top exports include soybeans and soybean meal, wheat, dairy products, and pork and pork products. In addition, U.S. fresh vegetable products face few restrictions and little competition. Since 2014, the United States has been the only country with access to the Philippines’ temperate vegetable market and, with limited domestic supply, this has created opportunities for U.S. exporters. Top U.S. competitors in the Philippine market are Indonesia, China, Malaysia, and Australia.
Malaysia Overview and Outlook
| Top Five U.S. Agricultural Exports to Malaysia | |||||||
| Product | Values in Millions USD | U.S. Market Share 2017 | U.S. Rank Among Suppliers | ||||
| 2013 | 2014 | 2015 | 2016 | 2017 | |||
| Total Agricultural Exports | 1033.8 | 963.4 | 837.9 | 800.9 | 924.0 | 7% | 7 |
| Soybeans | 152.6 | 164.3 | 137.5 | 158.3 | 172.7 | 40% | 1 |
| Dairy Products | 181.5 | 181.4 | 122.7 | 86.6 | 90.1 | 7% | 4 |
| Prepared Food | 110.0 | 99.1 | 95.2 | 85.1 | 89.8 | 13% | 4 |
| Cotton | 32.7 | 7.2 | 53.2 | 44.8 | 81.9 | 42% | 1 |
| Processed Vegetables | 50.6 | 44.3 | 45.7 | 50.8 | 56.7 | 28% | 2 |
| Source: USDA FAS GATS-BICO HS-10, Market share derived from IHS Markit | |||||||
With an estimated population of 31.6 million in 2017, Malaysia is one of the most developed nations in Southeast Asia. IHS Markit Economics predicts that, by 2021, the population will increase by 5.4 percent to 33.3 million, and 78 percent of the population will reside in urban areas. Malaysia’s per capita GDP is expected to increase from $25,655 in 2017 to $29,831 in 2021, and middle-class households are forecast to rise from 5 million in 2016 to 6 million in 2021.
Malaysia’s large and growing retail food sector is fragmented. While hypermarkets and large-format stores are the dominant retailers in the metropolitan areas where most middle- to high-income consumers reside, traditional markets still account for the majority of retail food sales.
The expanding hypermarket, supermarket, and internet retail sectors offer opportunities for U.S. food products. Influenced by growing purchasing power, cautious consumer spending, and the reintroduction of the sales and services tax in September 2018, the food retail sector is forecast to grow 3 percent, in line with the Government of Malaysia’s projection of 4-percent GDP growth.
In 2017, U.S. agricultural exports to Malaysia totaled $924 million, a 15-percent increase from 2016. Top U.S. exports include soybeans, dairy products, prepared food, cotton, and processed vegetables. As consumer demand shifts to higher-value products, opportunities exists for U.S. exports of infant food, fruit and vegetable juices, dried fruits, edible nuts, and temperate fresh vegetables and fruits. Top U.S. competitors in the Malaysian market are Thailand, Indonesia, China, Brazil, Argentina, Australia, and New Zealand.
Complex Policy and a Competitive Landscape
U.S. agricultural products are very competitive in Indonesia, Malaysia, and the Philippines, but exporters should be aware that these can be challenging marketplaces. The Indonesian government’s policies aimed at agricultural self-sufficiency are already threatening U.S. exports of soybeans, horticultural products, meat, and dairy. Import regulations are often complex and non-transparent, affecting horticultural and animal products in particular. As previously mentioned, halal certification is central to getting many food products into Malaysia and Indonesia. A host of burdensome tariff, sanitary and phytosanitary restrictions, and import licensing issues in the Philippines create difficulties for the sale of imported meats and other agricultural products.
In addition to trade issues, Indonesia, Malaysia, and the Philippines have all entered into, or are negotiating, bilateral and regional free trade agreements with U.S. competitors. This could affect the U.S. agricultural market share in these countries. Despite these challenges, opportunities for U.S. farm and food exports are significant. Consumer lifestyles and strong economic growth, along with recognition of high U.S. standards and quality, should help boost U.S. exports into the future.
1FAS define middle class as households earning $20,000 or more.
iSoutheast Asia includes Burma, Brunei, Cambodia, Indonesia, Laos, Malaysia, the Philippines, Singapore, Thailand, Timor-Leste, and Vietnam
iiAll macroeconomic data pertaining to the projection of populations, GDP growth, middle class income, and retail food and beverage sales and market share are provided by IHS Markit Economics and analyzed by the Office of Global Analysis.
iiiUSDA, Economic Research Service (ERS) defines Purchasing Power Parity as a concept in which a given amount of U.S. dollars will purchase the same bundle of goods in all economies. In calculating purchasing power parity, adjustments are made to exchange rates to raise or lower the relative value of currencies to equilibrate purchasing power.