
Spotlight: Australia’s Table Grapes
Contact:
Link to report:
Summary
Australia’s table grape sector has made great strides during the last 10 years, raising production by more than a third and exports by 50 percent. Despite 2 years of declining production and exports due to COVID-19 constraints, investments in vineyards prior to and during the pandemic have set the industry on a path to continue its upward trend. With exports on par with Egypt and the European Union and effectively competing with other Southern Hemisphere suppliers in Asia, Australia has become a significant world player.
Production Driven by Exports
Australian table grapes are grown in six of the eight states and territories, with production concentrated in Victoria and New South Wales. The Sunraysia and Murray Valley regions in Victoria account for more than 70 percent of production, while the two Riverina areas in New South Wales account for 10 percent. Both regions are characterized by a temperate climate, in which mild winters have sufficient chill hours to stimulate growth and encourage bud burst. Annual rainfall is low, occurring mostly outside the harvest period, and with free-draining sandy loam soil, vineyards are heavily dependent on irrigated water supplies. Australia’s harvest cycle starts in October in the Northern Territory and ends in May, with the bulk of production in the southern states of Victoria and New South Wales.
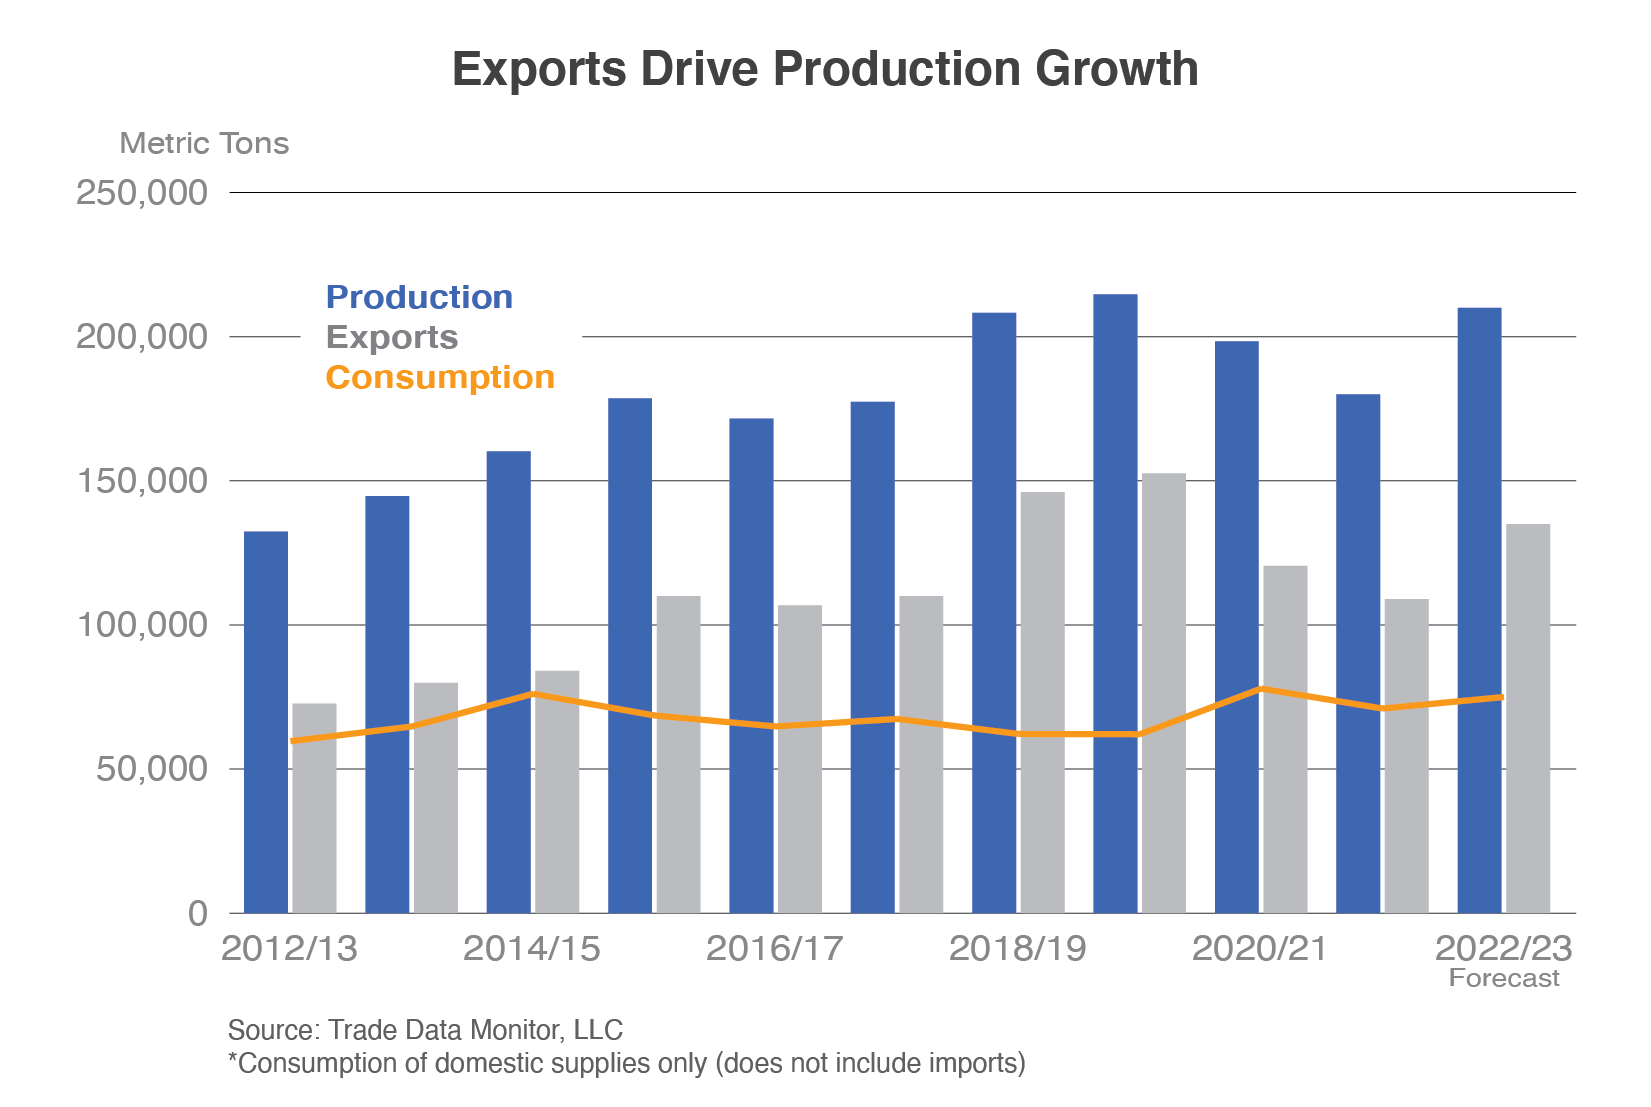
Australia ranks 13th among the world’s producers, averaging nearly 200,000 tons during the past 5 years, and fifth among Southern Hemisphere producers (based on 2021/221 estimates). Australia’s share of global production has been steady at 1 percent but has risen to 6 percent for Southern Hemisphere production. At the same time, Australia’s share of global exports has remained nearly flat at 3 percent but has risen to 7 percent among Southern Hemisphere countries, reaching as high as 10 percent in 2019/2020.
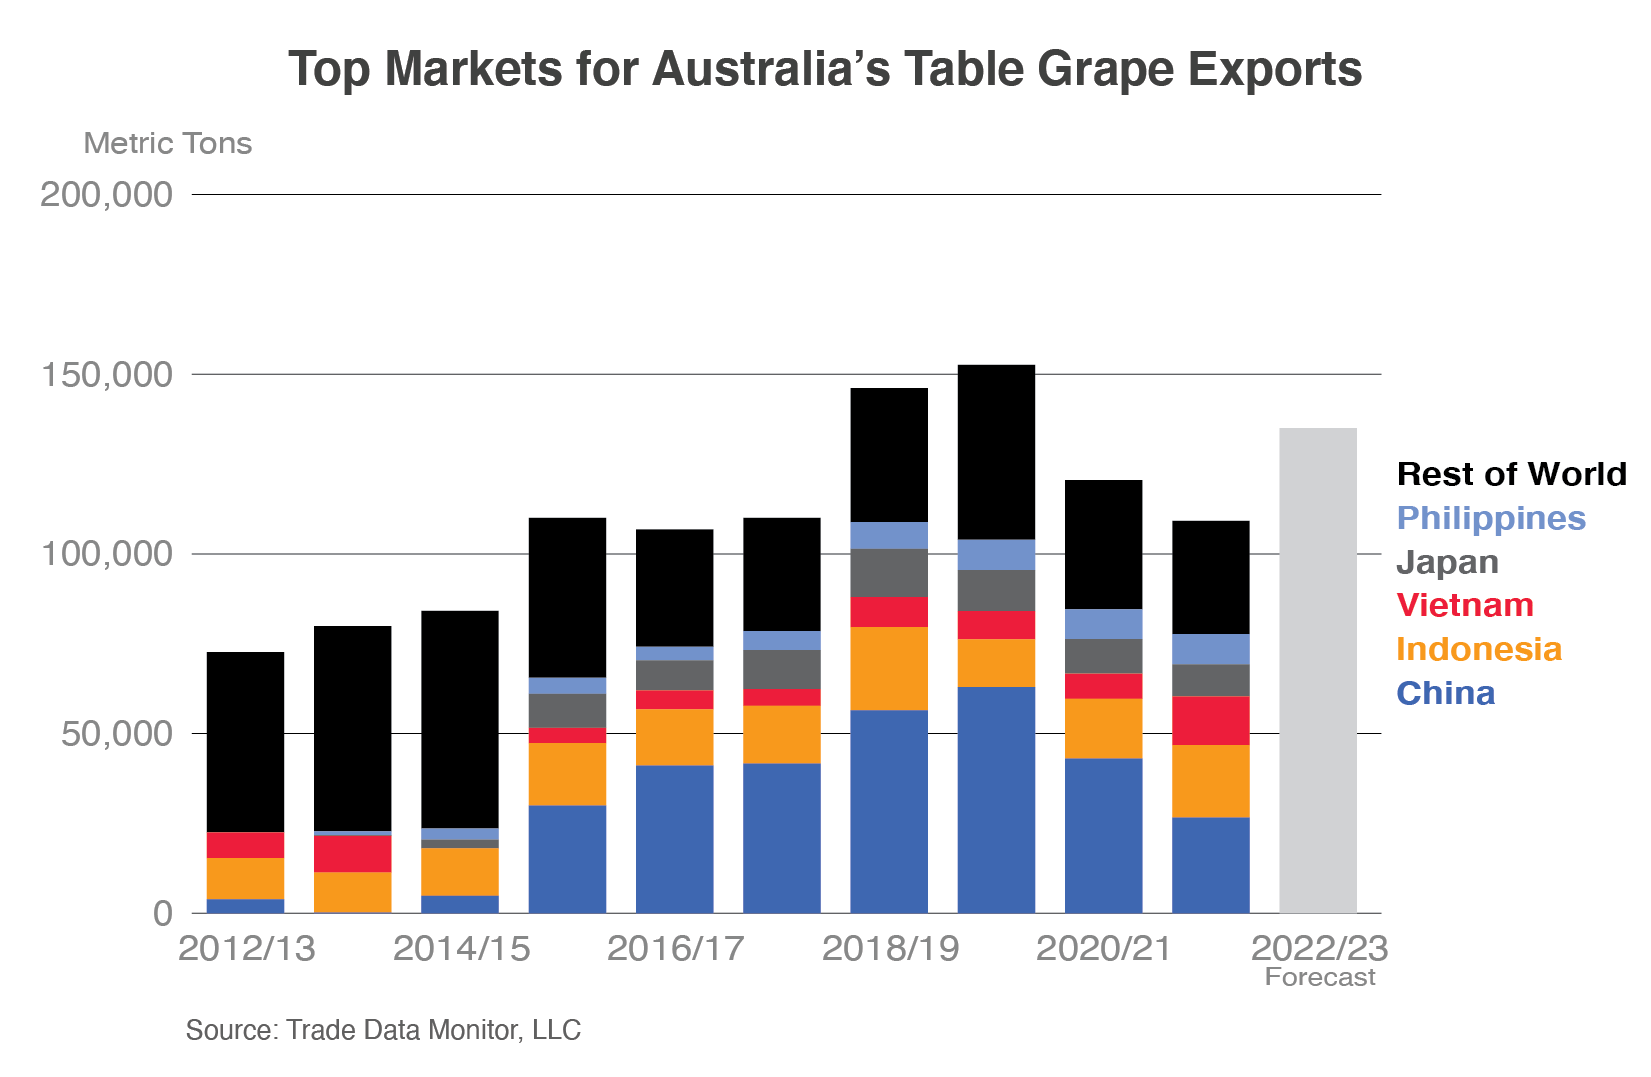
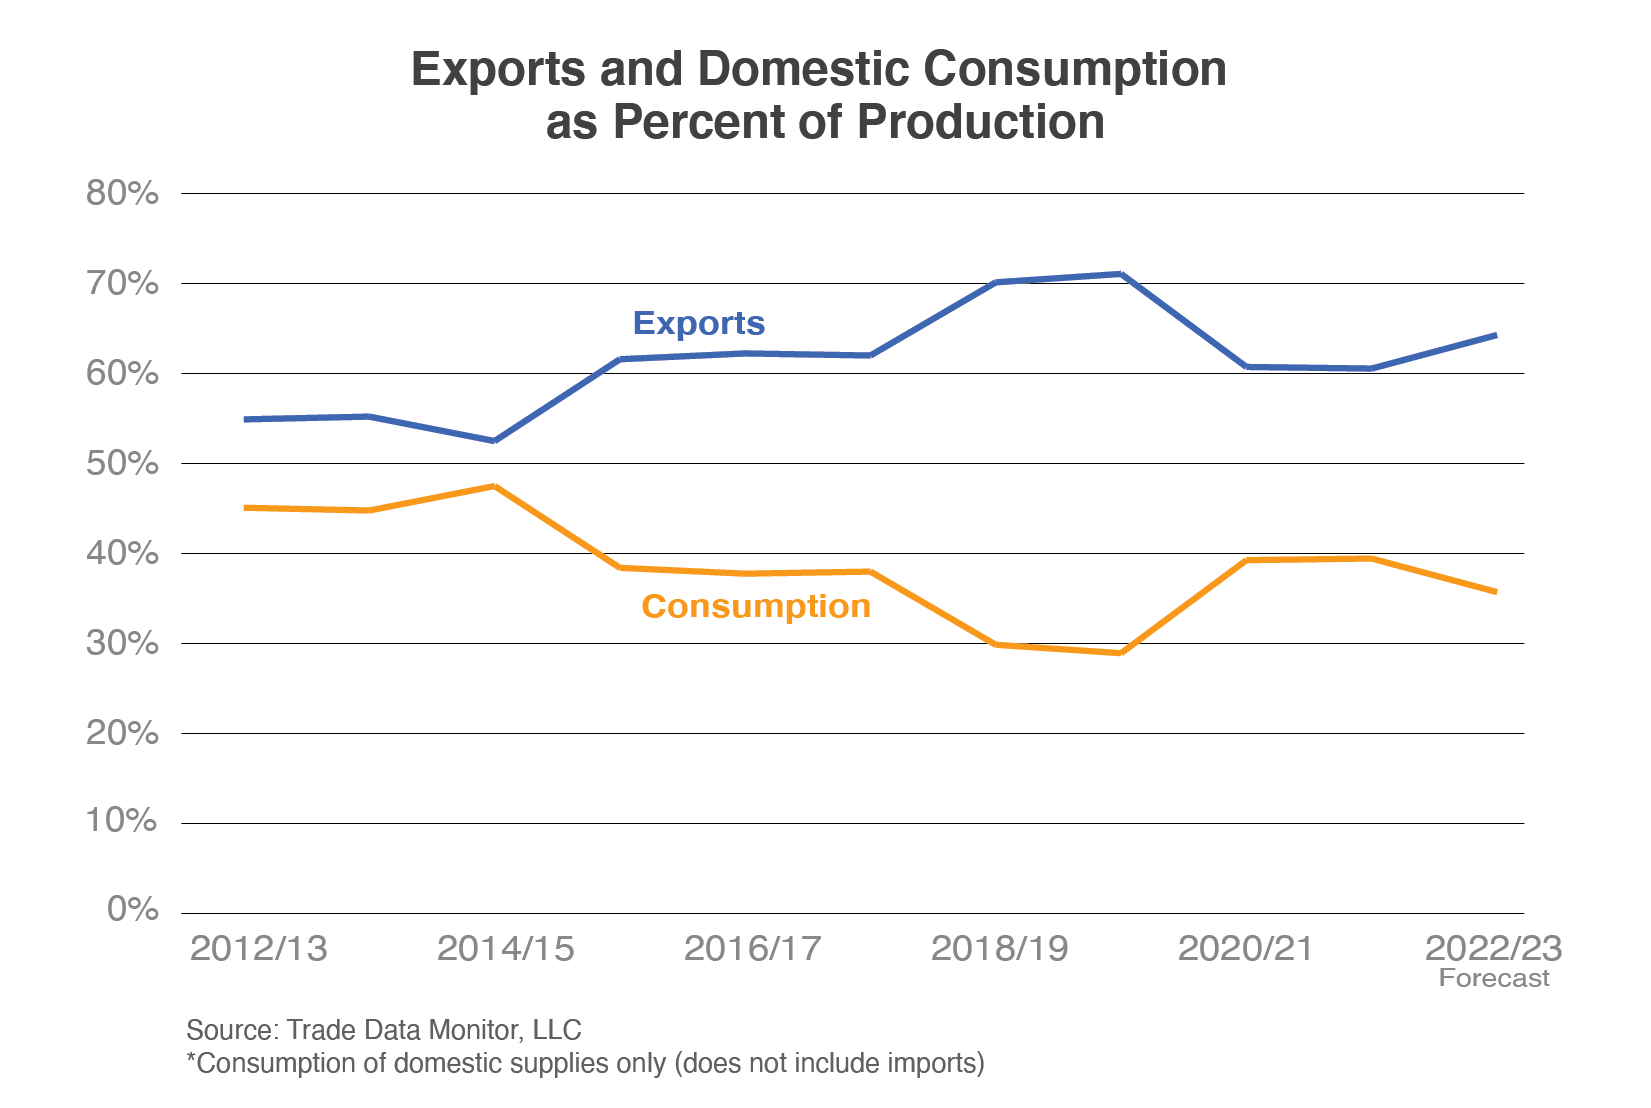
Like other major Southern Hemisphere table grape producers, Australia’s production is largely export-driven. Consumption of domestically produced supplies has averaged below 70,000 tons since 2012/13, contracting from 45 percent to a projected 36 percent of production in 2022/23. While consumption’s share of production has declined, the export share has risen from 55 percent to 64 percent in the forecast for 2022/23. Exports averaged nearly 130,000 tons during the past 5 years, near the levels of Egypt and the European Union. Australia’s export growth has largely been driven by China, which became its top market in 2015/16 at 30,000 tons, marking a new record for exports to a single country. Chinese tariffs on Australian table grapes fell to zero in 2019 as part of the China-Australia Free Trade Agreement, and exports to China reached a peak of 63,000 tons. Australia’s total exports also reached a record 153,000 tons, more than doubling in less than 10 years.
Following the 2019/20 peak, however, exports have fallen nearly 30 percent and yield has declined as output has been affected by weather and impacts from COVID-19. Above-average rains affected crop quality. The pandemic also led to a labor shortage that prevented quick harvesting, thereby reducing growers’ ability to mitigate the impact of the rain damage. Shipments of subsequently lower supplies were also affected by higher freight rates and container shortages. Despite these challenges, export volumes remained above 100,000 tons, and most top markets showed growth. Exports to China declined nearly 60 percent since 2019/20 but remained Australia’s top market at 27,000 tons in 2021/22, followed by Indonesia (up 26 percent since 2017/18 to 20,000 tons) and Vietnam (nearly tripling since 2017/18 to 14,000 tons). China is a major exporter of table grapes, especially to Vietnam and Thailand, but Australia’s shipments are counter-seasonal, competing with the Southern Hemisphere powerhouses of Chile and Peru. Despite significantly lower production, Australia’s shipments to Asian markets often exceed those of Chile and Peru. This is aided by Australia’s proximity, which gives it advantages like reduced shipping time and a lower risk of deteriorating fruit quality.
An Advancing Industry
To support strong export demand, table grape acreage has been expanding, including through the conversion of wine grape vineyards to table grapes. Production is currently dominated by the Menindee and Thompson green varieties and the red Crimson2, but new proprietary seedless varieties make up the bulk of new plantings in the new acreage.3 With Asia accounting for nearly 95 percent of Australia’s exports in 2021/22, consumer preferences are greatly influencing the varietal choices of Australia’s growers. The seeded Red Globe has been the dominant grape exported to China, but consumers across Asia are increasingly turning towards seedless varieties, which also offer a wider selection of flavors, including black grapes, which are gaining broader global interest. Industry estimates indicated that table grape plantings were increasing at a rate of 20 percent per year prior to COVID-19. While continuing through the pandemic, plantings occurred at a reduced rate due to the related shortage of harvest labor.
Australia’s table grape industry has built a strong extension program to aid growers and improve production through communication and concerted efforts to share information. The program enables growers to adopt new practices by providing services to growers, including research and development activities, workshops and field days on best management practices and technologies, and resources for grower inquiries.4 This program is funded through table grape levy funds collected by the Australian Government and then passed to Hort Innovation*, which invests the funds in research and development projects in consultation with the industry.
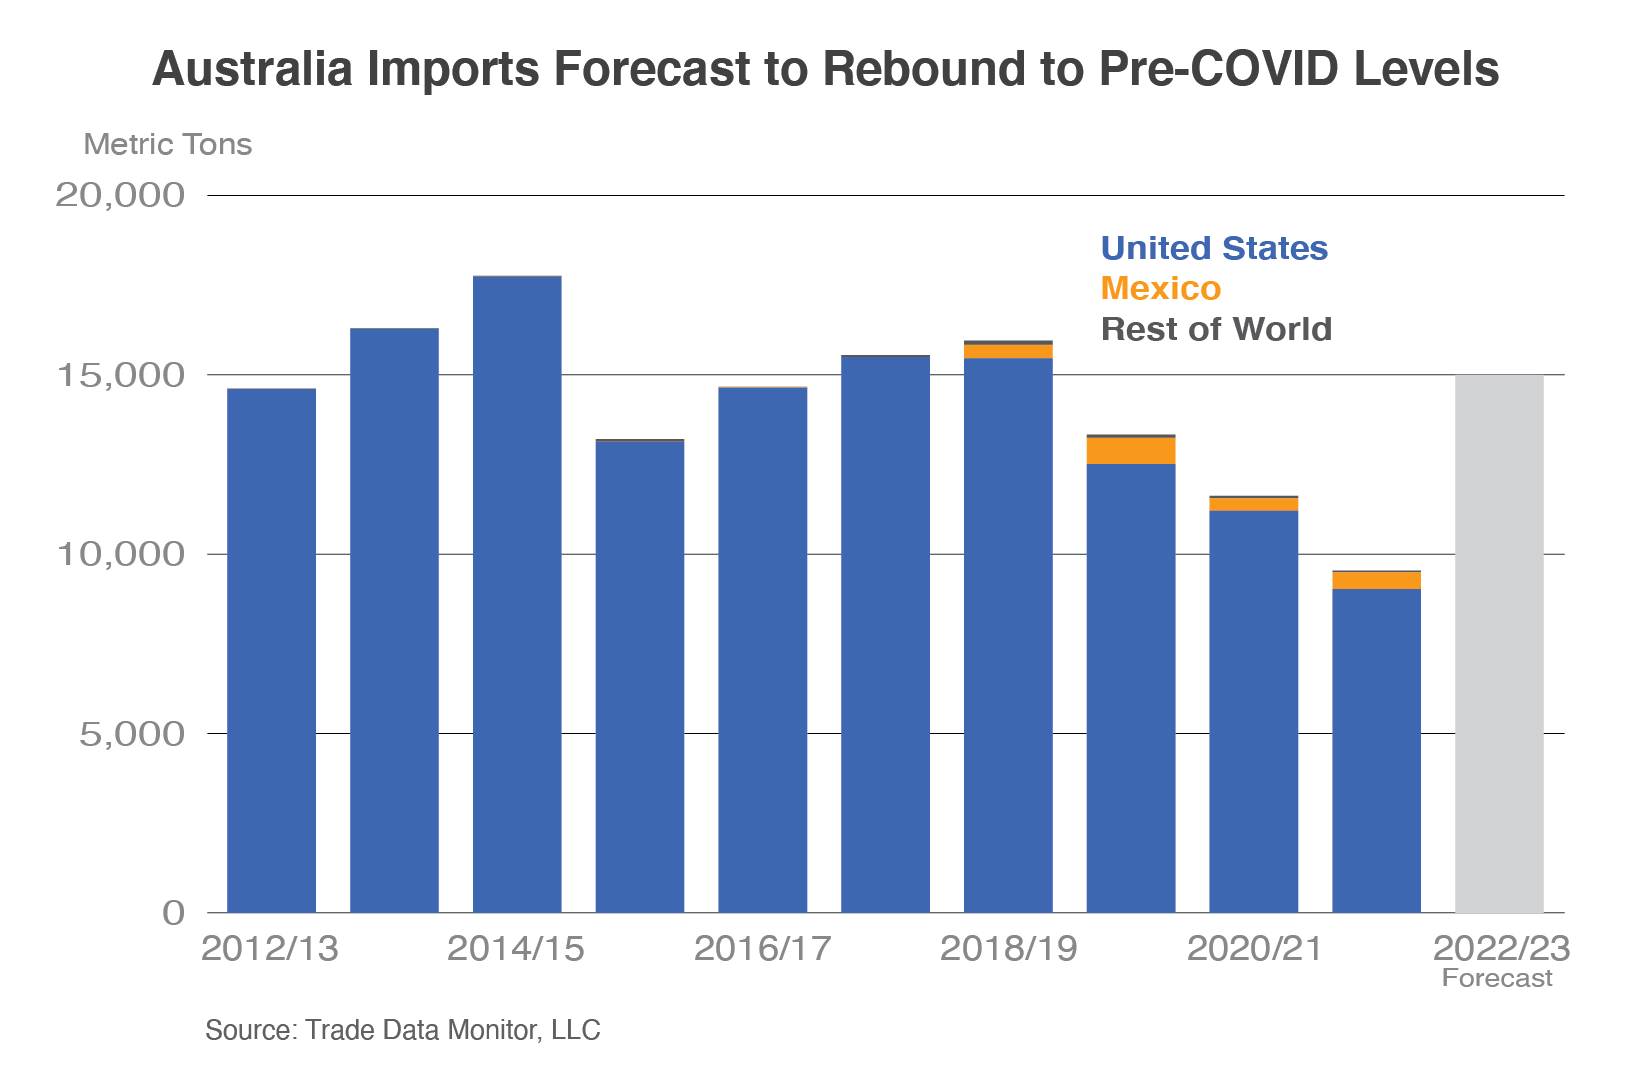
Unlike other Southern Hemisphere producers, Australia also imports significant amounts of table grapes. Domestic supplies are augmented with imports ranging from 10,000 to 20,000 tons, supplied almost exclusively by the United States during the months of Australia’s off-season. However, Hort Innovation is also conducting a national domestic campaign to increase domestic purchases, with marketing activities ranging from in-store and social media to radio advertisements. As imports of U.S. grapes prepare consumers for the arrival of domestic product in Australian stores, this marketing campaign could in turn boost imports, raising consumer demand and improving purchases during their off-season. Australia was the United States’ sixth-largest market in 2021/22, valued at $34 million (10,000 tons).
Looking Forward
A shortage of harvest labor is expected to impact production and exports again in 2022/23. However, with shipping availability improving and new plantings continuing to come online, current U.S. Department of Agriculture (USDA) forecasts are for rebounds to pre-COVID-19 levels, with production rising to 210,000 tons and exports reaching 135,000. Victoria experienced flooding in December 2022, and it is yet to be seen how this will affect the 2022/23 crop and longer-term production; USDA forecasts will be updated on June 13, 2023. However, as new plantings continue to come online and reach maturity, they are expected to boost production and exports to even higher levels in the coming years.
1 The marketing year for Australia is October-September.
2 Hort Innovation, “Australia Horticulture Statistics Handbook 2020/21.”
3 FAS/Canberra, GAIN report AS2022-0022, “Fresh Deciduous Fruit Annual,” September 21, 2022.
4 Hort Innovation, Table Grape Fund Annual Report 2021/22.
* Hort Innovation: “the grower-owned, not-for-profit research and development corporation for Australia's horticulture industry” (https://www.horticulture.com.au/hort-innovation/the-company/)
Market share and global trade information is from Trade Data Monitor, LLC, unless otherwise indicated.