
Thailand 2020 Export Highlights
Top 10 U.S. Agricultural Exports to Thailand(values in million USD) |
|||||||
| Commodity | 2016 | 2017 | 2018 | 2019 | 2020 | 2019-2020 % Change | 2016-2020 Average |
| Soybeans | 362 | 467 | 593 | 524 | 568 | 8% | 503 |
| Wheat | 147 | 175 | 180 | 162 | 171 | 5% | 167 |
| Prepared Food | 125 | 131 | 133 | 137 | 129 | -6% | 131 |
| Cotton | 164 | 213 | 273 | 215 | 119 | -45% | 197 |
| Feeds & Fodders | 82 | 84 | 84 | 86 | 100 | 16% | 87 |
| Dairy Products | 35 | 50 | 35 | 56 | 75 | 34% | 50 |
| Tree Nuts | 31 | 22 | 32 | 42 | 36 | -12% | 33 |
| Fresh Fruit | 40 | 37 | 39 | 45 | 35 | -22% | 39 |
| Hides & Skins | 60 | 129 | 120 | 59 | 32 | -45% | 80 |
| Chocolate & Cocoa Products | 12 | 15 | 15 | 20 | 20 | -3% | 16 |
| All Other | 536 | 516 | 617 | 479 | 490 | 2% | 528 |
| Total Exported | 1,594 | 1,839 | 2,121 | 1,825 | 1,775 | -3% | 1,831 |
Source: U.S. Census Bureau Trade Data - BICO HS-10
Highlights
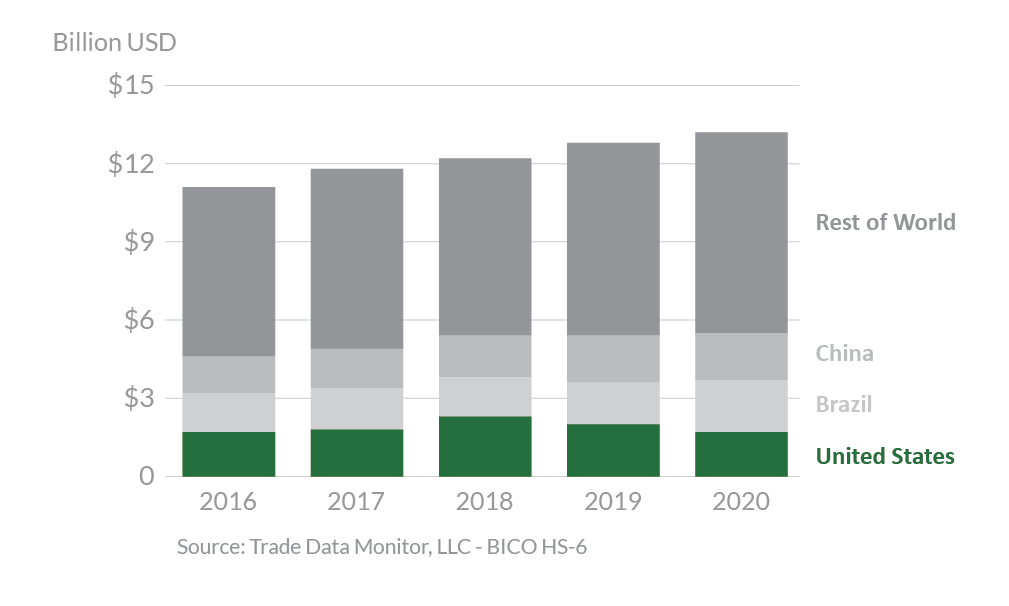
In 2020, Thailand was the 14th-largest destination for U.S. agricultural exports, totaling $1.8 billion. This represents a 3-percent decrease from 2019. The United States was Thailand’s third-largest supplier of agricultural goods with 13 percent market share, behind Brazil with 15 percent and China with 13 percent. The largest export growth seen last year was in distillers’ grains and soybeans, up more than $71 million and $44 million, respectively. Additionally, exports of dairy products, feeds & fodders, and wheat increased by $19 million, $14 million, and $9 million, respectively. Exports of cotton were down by $96 million. Exports of soybean meal, hides & skins, and fresh fruit decreased by $50 million, $27 million, and $10 million, respectively.
Drivers
- The COVID-19 pandemic hit Thailand’s service sector the hardest, which accounts for 63 percent of gross domestic product and constitutes around half of total employment.
- Competitive prices are important for U.S. agricultural products’ market share due to strong competition from key suppliers that have free trade agreements with Thailand.
- Increasing live swine exports to neighboring countries that had African swine fever outbreaks boosted import demand for feed ingredients, especially for U.S. full-fat soybean and dried distillers’ grains.
- Flour mills built up their wheat inventories to cushion the trade impact of new government import regulations to be implemented in June 2021, leading to an unusual increase in import demand for wheat grain.
- COVID-19 related measures accelerated the online food business in Thailand, creating new opportunities for U.S. consumer-ready products.
- The country’s increasing urbanization has contributed to a growing demand for imported, high-value food and beverage products among the middle- and upper-income population.
Thailand’s Agricultural Suppliers
Looking Ahead
In 2020, the effects of the COVID-19 pandemic contributed to a 6-percent contraction of Thailand’s real GDP from 2019. The economy is expected to recover when foreign tourists return after pandemic restrictions are lifted. The recovery in tourism will drive import demand for U.S. commodity and food products, especially for high-value consumer products such as beef, dairy products, fresh fruits, frozen and dehydrated potatoes, nuts, processed and frozen ready-to-eat foods, fruit juices, and alcoholic beverages (including wine, beer, and spirits).
Thai consumers have increased their demand for “immunity boosting” foods such as fresh fruits, vitamin beverages, dried fruits & nuts, and food supplements. This will create excellent market opportunities for U.S. suppliers.
Soybeans from the United States are expected to lose market share relative to cheaper soybeans from Brazil, as upward pressure from Chinese demand raises U.S. prices. Additionally, the Regional Comprehensive Economic Partnership (RCEP) that Thailand signed in November 2020 with 14 other countries provides preferential access for some products and will likely increase the cost of U.S. products compared to RCEP countries.