Thailand 2019 Export Highlights
Top 10 U.S. Agricultural Exports to Thailand(values in million USD) |
|||||||
| Commodity | 2015 | 2016 | 2017 | 2018 | 2019 | % Change 2018-2019 |
5-Year Average 2015-2019 |
| Soybeans | 229 | 362 | 467 | 593 | 525 | -12% | 435 |
| Cotton | 173 | 164 | 214 | 273 | 214 | -22% | 208 |
| Wheat | 204 | 147 | 175 | 180 | 162 | -10% | 173 |
| Prepared Food | 107 | 126 | 131 | 133 | 137 | 3% | 127 |
| Feeds & Fodders | 103 | 82 | 84 | 85 | 86 | 2% | 88 |
| Soybean Meal | 339 | 155 | 142 | 130 | 59 | -55% | 165 |
| Hides & Skins | 47 | 60 | 129 | 120 | 59 | -51% | 83 |
| Dairy Products | 58 | 35 | 50 | 35 | 56 | 62% | 47 |
| Fresh Fruit | 45 | 40 | 37 | 40 | 45 | 15% | 41 |
| Tree Nuts | 38 | 31 | 22 | 32 | 42 | 29% | 33 |
| All Other | 357 | 393 | 389 | 502 | 441 | -12% | 417 |
| Total Exported | 1,699 | 1,594 | 1,839 | 2,122 | 1,825 | -14% | 1,816 |
Source: U.S. Census Bureau Trade Data - BICO HS-10
Highlights
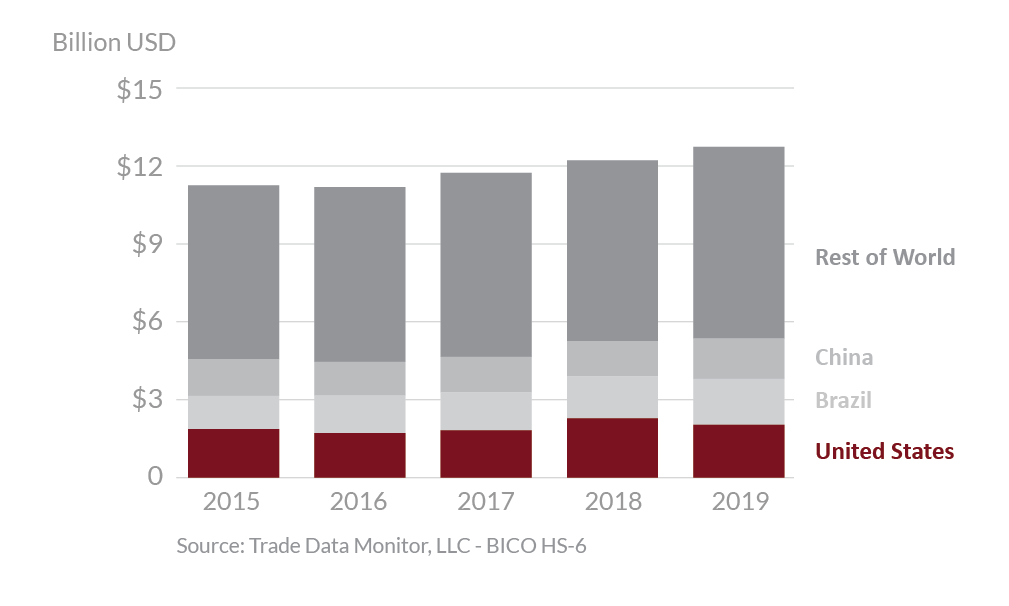
In 2019, Thailand was the 14th largest destination for U.S. agricultural exports, which totaled $1.8 billion, a 14 percent decrease from 2018. The United States was Thailand’s top supplier of agricultural goods with 16 percent market share, followed by China with 14 percent. Thailand’s free trade agreements with China, Australia, New Zealand, Chile, Japan, Korea, Peru, and India have made U.S. products less competitive especially for high value consumer products such as meats, processed meat, wine, spirits, cherries, peaches, plums, pears, frozen potatoes, and cheeses. The largest export growth was seen in dairy products and tree nuts, up $22 million and $9 million, respectively. Additionally, increases in exports of fresh fruits, chocolate & cocoa products, and prepared food were up $6 million, $5 million, and $4 million, respectively. Exports of distillers’ grains were down by $85 million. Exports of soybean meal, soybeans, and hides & skins were down $71 million, $69 million, and $61 million, respectively.
Drivers
-
Thai imports from the U.S. were down from 2018 highs as China purchased more U.S. goods driving up prices of U.S. bulk goods.
-
Thailand’s urban consumers (54 percent of overall population) are increasingly spending more on imported food items and accepting more western style foods and dining options.
-
According to Euromonitor, food and beverage revenue generated from food delivery is expected to reach U.S. $1.6 billion by 2022, up from $1 billion in 2018.
-
Thailand’s dynamic young population (29 percent of the total population is between the ages of 15 and 35) is very receptive to trends fitting their modernized lifestyles including the demand for convenience foods.
Thailand's Agricultural Suppliers


Looking Ahead
Thailand is Southeast Asia’s second largest economy and remains a strong agricultural competitor as the world’s leading exporter of natural rubber, frozen shrimp, canned tuna, canned pineapples, cooked poultry, and cassava. It is also a major exporter of sugar and rice. With rapidly growing sectors of retail foods, food service, and food processing, Thailand presents many market opportunities for U.S. suppliers of ingredients and raw materials.
Thailand has preferential trade arrangements with the Association of Southeast Asian Nation countries (ASEAN), Australia-New Zealand, China, India, Japan, Peru, South Korea, and Chile. Thailand has been in negotiation for bilateral free trade arrangements with the European Union, Pakistan, Sri Lanka, Turkey, and the Regional Comprehensive Economic Partnership (RCEP). These agreements put U.S. agricultural exports at a clear disadvantage due to import tariff differentials, with many of these agreements eliminating tariffs on agricultural imports. The United States has no trade agreements with ASEAN nor Thailand.
The United States will continue to work to address the Thai government’s resistance to establishing MRLs for ractopamine (restricting pork access) and food colorings and preservatives (restricting processed foods and wine). Additionally, the United States will encourage Thailand to work with its own industry and adopt less trade disruptive approaches for new/novel food product registration by utilizing a science-based process. The Thai population has become increasingly health conscious and focuses more on healthy eating and living with an increased demand for quality foods. Consumers are looking more and more at the quality of their food, seeking healthy food ingredients, better sources of protein and more complete nutrients. This increased demand for healthy foods offers opportunities for U.S. exporters of tree nuts, fresh and processed fruits and vegetables and other prepared foods.
