
Taiwan 2020 Export Highlights
Top 10 U.S. Agricultural Exports to Taiwan(values in million USD) |
|||||||
| Commodity | 2016 | 2017 | 2018 | 2019 | 2020 | 2019-2020 % Change | 2016-2020 Average |
| Soybeans | 579 | 586 | 854 | 685 | 604 | -12% | 662 |
| Beef & Beef Products | 363 | 409 | 552 | 568 | 552 | -3% | 489 |
| Wheat | 257 | 295 | 267 | 324 | 311 | -4% | 291 |
| Poultry Meat & Products* | 127 | 152 | 189 | 187 | 224 | 20% | 176 |
| Fresh Fruit | 220 | 218 | 199 | 252 | 197 | -22% | 217 |
| Corn | 460 | 395 | 593 | 228 | 179 | -22% | 371 |
| Prepared Food | 162 | 149 | 154 | 149 | 141 | -5% | 151 |
| Dairy Products | 72 | 83 | 93 | 109 | 121 | 11% | 96 |
| Processed Vegetables | 71 | 71 | 71 | 73 | 73 | 1% | 72 |
| Non-Alcoholic Beverages** | 68 | 61 | 61 | 72 | 71 | -1% | 67 |
| All Other | 847 | 898 | 916 | 918 | 789 | -14% | 874 |
| Total Exported | 3,226 | 3,317 | 3,949 | 3,565 | 3,262 | -9% | 3,464 |
Source: U.S. Census Bureau Trade Data - BICO HS-10
*Excludes eggs
**Excludes juices
Highlights
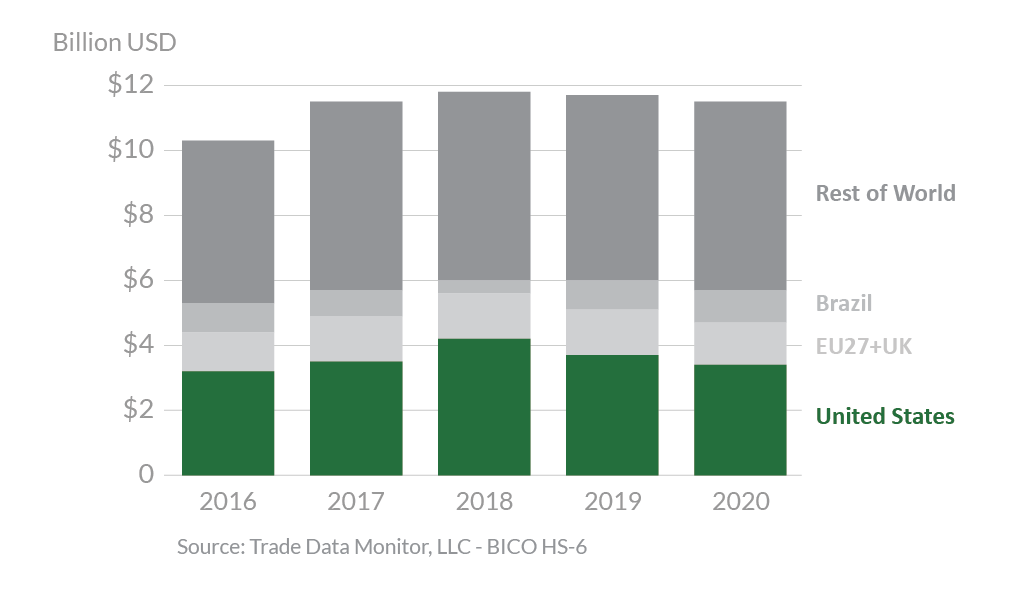
In 2020, Taiwan was the eighth-largest destination for U.S. agricultural exports, totaling $3.3 billion. This represents a 9-percent decrease from 2019, and a 17-percent decrease from a record $3.9 billion in 2018. The United States is Taiwan’s top supplier of agricultural goods with 29 percent market share, followed by the EU27+UK with 12 percent. In 2020, the largest export growth was in poultry meat & products (excluding eggs), up $37 million. Dairy products also rose, up 11 percent to $121 million. Virtually all other top commodities to Taiwan declined in value. Exports of U.S. soybeans decreased by more than $80 million, while exports of corn continued to fell due in part to lower domestic consumption, higher U.S. prices, and competition from South America. Shipments of fresh fruit, beef & beef products, and wheat were down $55 million, $16 million, and $13 million, respectively. While Taiwan is one of the largest per capita consumers of U.S. agricultural goods, U.S. food products are facing increased competition from third country competitors with preferential trade agreements, such as beef and dairy products from New Zealand.
Drivers
- Increased soybean prices, combined with lower coronavirus pandemic-related food and feed demand, resulted in decreased exports from 2018 and 2019 levels.
- Higher prices, competition from South America, and effects from the coronavirus pandemic resulted in slightly decreased corn exports.
- U.S. poultry meat and products increased by 20 percent in 2020, aided by a decrease in Taiwan’s poultry production.
- Taiwan’s developed economy, relatively high per-capita income, and deepening ties with the United States continue to make it an important agricultural export market for U.S. producers.
Taiwan’s Agricultural Suppliers
Looking Ahead
Taiwan’s successful response to the coronavirus pandemic resulted in extremely low levels of virus transmission, setting the stage for economic growth as global demand recovers. Changing consumer preferences and eating habits provide continued opportunities to U.S. exporters in higher value agricultural commodities and consumer-oriented food products. U.S. agricultural exports will remain strong. However, pork exports are decreasing, as regulatory actions implemented on January 1, 2021, including country-of-origin labeling measures, continue to affect the market.
Importantly, Taiwan announced the easing of restrictions on imports of U.S. pork and beef in August 2020, allowing products containing ractopamine.