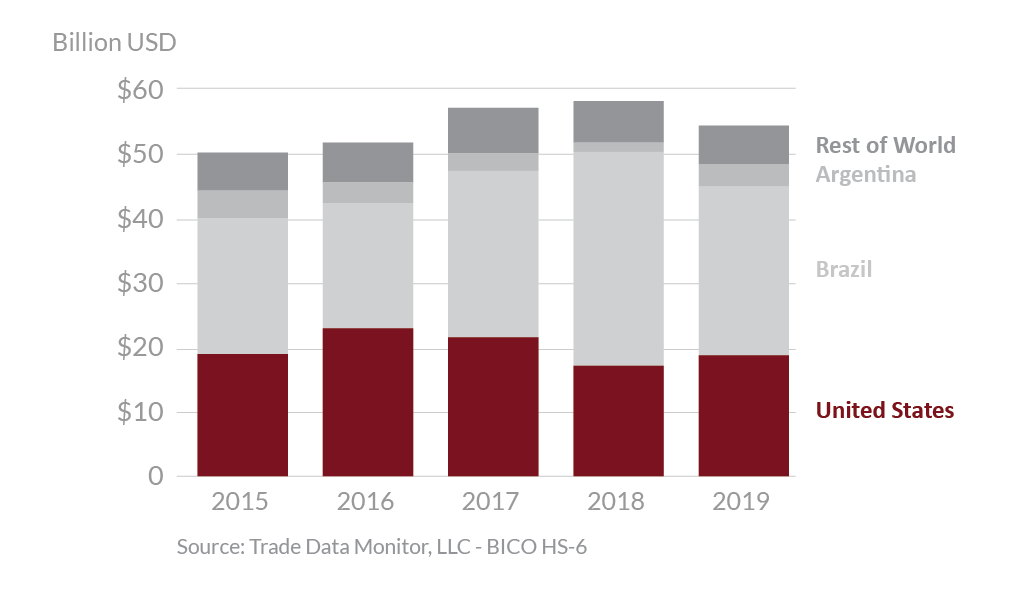
Soybeans 2019 Export Highlights
Top 10 Export Markets for U.S. Soybeans(values in million USD) |
|||||||
| Country | 2015 | 2016 | 2017 | 2018 | 2019 | % Change 2018-2019 |
5-Year Average 2015-2019 |
| China | 10,489 | 14,203 | 12,224 | 3,119 | 7,989 | 156% | 9,605 |
| European Union | 1,898 | 1,899 | 1,637 | 3,078 | 1,953 | -37% | 2,093 |
| Mexico | 1,432 | 1,462 | 1,574 | 1,822 | 1,867 | 2% | 1,632 |
| Egypt | 162 | 100 | 365 | 1,164 | 995 | -14% | 557 |
| Japan | 1,048 | 1,001 | 974 | 927 | 965 | 4% | 983 |
| Indonesia | 773 | 988 | 921 | 999 | 862 | -14% | 909 |
| Taiwan | 578 | 579 | 586 | 854 | 677 | -21% | 655 |
| Thailand | 229 | 362 | 467 | 593 | 525 | -12% | 435 |
| South Korea | 223 | 227 | 295 | 327 | 396 | 21% | 294 |
| Bangladesh | 301 | 228 | 391 | 434 | 388 | -11% | 348 |
| All Others | 1,730 | 1,791 | 2,023 | 3,746 | 2,045 | -45% | 2,267 |
| Total Exported | 18,862 | 22,840 | 21,456 | 17,063 | 18,660 | 9% | 19,776 |
Source: U.S. Census Bureau Trade Data - BICO HS-10
Highlights
In 2019, the value of U.S. soybean exports to the world reached $18.7 billion, up 9 percent in value from the prior year and up 13 percent in volume. A substantial increase in exports to China offset declining exports to other major markets. However, U.S. exports to China were still 3 million metric tons below 2017 levels. Despite year-on-year export growth in 2019, the total value of U.S. soybean exports was 14 percent below the 5-year average of 2013-2017.
Drivers
-
Abundant U.S. soybean supplies, partly due to lower export volumes and increased stocks in 2018, pressured prices lower in 2019.
-
Lower demand for swine feed in China due to African Swine Fever reduced global demand for soybeans. However, China’s imports of U.S. soybeans increased substantially at the end of 2019 with easing trade tensions and in line with historical season patterns.
-
Exports to the EU fell 35 percent by volume as Brazil’s price premium against the United States fell.
-
Exports to traditional trading partners Mexico, Japan and South Korea continued to grow rising 2, 4, and 21 percent, respectively.
Global Soybean Exports

U.S. soybean exports are forecast up for the marketing year ending in September 2020 (MY 2019/20). U.S. exporters will likely see increased demand from China, where total imports are forecast 6 percent higher by volume over this period. However, Chinese demand will depend on expansion in China’s livestock and poultry production with the swine sector still hampered by recovery from African Swine Fever. U.S. sales to China will depend on the availability of exemptions from Chinese tariffs and its compliance with the Phase One trade agreement. The United States will see increased competition from Brazil which is forecast to produce a record quantity of soybeans in MY 2019/20. Mexican imports are forecast to remain high in MY2019/20, providing an opportunity for U.S. exports. EU imports are forecast to increase in MY2019/20. However, U.S. performance in the EU market will depend on its price competitiveness with Brazil which is benefitting from depreciation of its currency. The COVID-19 pandemic may affect the global demand for food and feed as people stay home and eat out less.
