
Soybean 2021 Export Highlights
Top 10 Export Markets for U.S. Soybeans(values in million USD) |
|||||||
| Country | 2017 | 2018 | 2019 | 2020 | 2021 | 2020-2021 % Change | 2017-2021 Average |
| China | 12,224 | 3,119 | 8,005 | 14,077 | 14,134 | 0% | 10,312 |
| Mexico | 1,574 | 1,818 | 1,878 | 1,878 | 2,669 | 42% | 1,963 |
| European Union-27 | 1,637 | 2,968 | 1,853 | 1,889 | 2,223 | 18% | 2,114 |
| Egypt | 364 | 1,164 | 995 | 1,444 | 1,434 | -1% | 1,080 |
| Japan | 973 | 927 | 971 | 1,064 | 1,350 | 27% | 1,057 |
| Indonesia | 922 | 998 | 868 | 887 | 1,085 | 22% | 952 |
| Taiwan | 586 | 854 | 691 | 606 | 736 | 21% | 695 |
| Bangladesh | 391 | 434 | 388 | 484 | 476 | -2% | 434 |
| Thailand | 467 | 593 | 531 | 568 | 466 | -18% | 525 |
| Vietnam | 288 | 469 | 273 | 425 | 395 | -7% | 370 |
| All Others | 2,029 | 3,713 | 2,240 | 2,201 | 2,440 | 11% | 2,525 |
| Total Exported | 21,456 | 17,058 | 18,694 | 25,522 | 27,408 | 7% | 22,027 |
Source: U.S. Census Bureau Trade Data - BICO HS-10
Highlights
In 2021, the value of U.S. soybean exports to the world reached a new record at $27.4 billion, up 7 percent from the prior year’s record. Export value is up on a 29-percent jump in unit values more than offsetting a 17-percent drop in volume. Mexico accounted for more than 40 percent of the export value growth, as tonnage was up marginally despite higher unit values. Most of the remaining growth came from the EU, Japan, Turkey, and Indonesia. Sales to China remained relatively flat as a 20-percent drop in export volume offset stronger prices. The total value of U.S. soybean exports was 30 percent above the 5-year average of 2016-2020.
Drivers
- Unit values for U.S soybean exports were more than 25 percent higher than the previous year on tight exporter supplies and China’s strong demand, driving value growth despite lower volume.
- Exports to Mexico rose on higher unit value as quantity remained stable.
- Exports to China increased substantially at the end of 2020 into early 2021 as its swine industry recovered from ASF and soybean demand returned to pre-ASF levels. While 2021 exports were up slightly over the previous year, much of this was based on higher unit values as the volume of exports declined by 20 percent. Exports to the EU fell 11 percent by volume as U.S. market share in the EU contracted for the third straight year.
- Exports to Japan climbed nearly 30 percent, by value, reaching the second highest level on record (2008 was record). Exports by volume declined by 5 percent, remaining steady with annual imports of 2.4 million tons.
- The value of U.S. soybean exports to Turkey shot up from virtually zero to nearly $200 million after the approval of six new soybean biotech products.
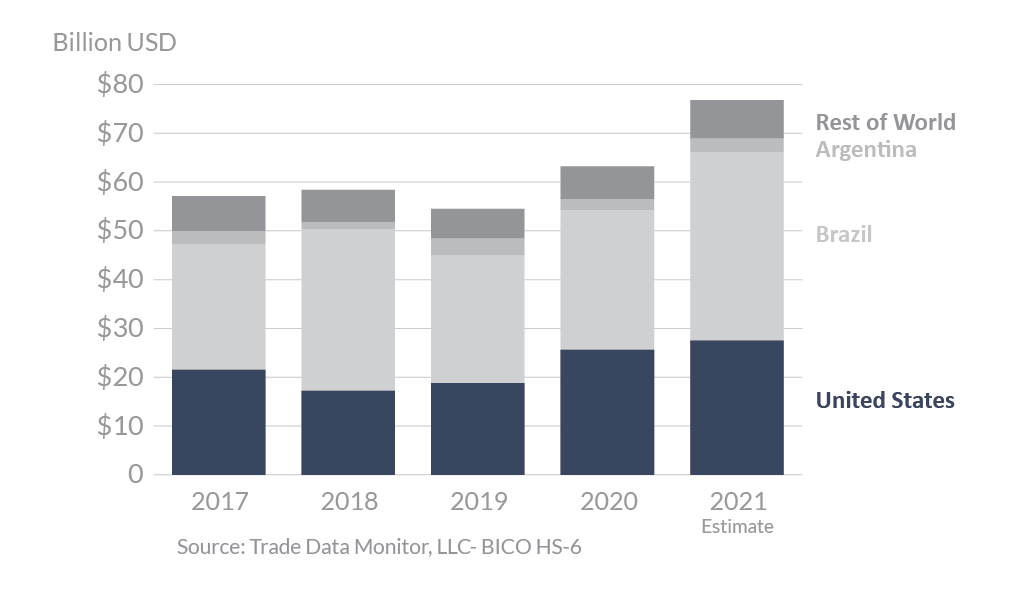
Global Soybean Exports
Looking Ahead
U.S. soybean exports are forecast down 9 percent to 55.8 million tons for the marketing year ending in September 2022 (MY 2021/22). U.S. exporters will likely see reduced demand from China, where total imports are forecast 3 percent lower by volume over this period. China soybean imports and crush pace have slowed in early 2022 on higher prices, driving crush margins negative. Import demand from other key U.S. trading partners like Mexico, Egypt, Japan, and Bangladesh is forecast to remain high in 2021/22, providing an opportunity for U.S. exports. EU imports are forecast to remain flat in 2021/22. However, U.S. performance in this market will depend on its price competitiveness with Brazil, which has been hampered by the depreciation of the real over the past few years. On the export side, 2021/22 soybean production in Brazil, Argentina, and Paraguay is forecast down 5 percent from the previous harvest on dry weather. If realized, South American soybean supplies will be tight going into the final quarter of 2022, which would both support high prices and reduce export competition from Brazil at the start of the next U.S. soybean harvest and peak selling timeframe.