
Rice 2021 Export Highlights
Top 10 Export Markets for U.S. Rice(values in million USD) |
|||||||
| Country | 2017 | 2018 | 2019 | 2020 | 2021 | 2020-2021 % Change | 2017-2021 Average |
| Mexico | 292 | 268 | 278 | 245 | 306 | 25% | 278 |
| Japan | 190 | 232 | 275 | 261 | 289 | 11% | 249 |
| Haiti | 237 | 206 | 206 | 245 | 218 | -11% | 223 |
| Canada | 148 | 175 | 194 | 194 | 199 | 2% | 182 |
| Korea, South | 85 | 89 | 120 | 153 | 132 | -13% | 116 |
| Saudi Arabia | 88 | 73 | 98 | 106 | 83 | -22% | 90 |
| Venezuela | 67 | 16 | 18 | 31 | 81 | 160% | 42 |
| Jordan | 90 | 66 | 73 | 74 | 65 | -13% | 74 |
| Honduras | 45 | 61 | 47 | 46 | 53 | 16% | 50 |
| Iraq | 19 | 89 | 72 | 0 | 46 | - | 45 |
| All Others | 447 | 404 | 470 | 512 | 440 | -14% | 455 |
| Total Exported | 1,709 | 1,678 | 1,851 | 1,867 | 1,912 | 2% | 1,803 |
Source: U.S. Census Bureau Trade Data - BICO HS-10
Highlights
In 2021, the value of U.S. processed food exports increased by 11 percent year-over-year to a record $13.9 billion. Canada remains the top market with $5.2 billion worth of exports, representing 38 percent of all U.S. processed food exports. Mexico is the second-largest market with $1.8 billion and had the highest year-over-year value growth of $416 million (30 percent) in 2021. Because of access under the United States-Mexico-Canada Agreement (USMCA) and proximity to the United States, Canada and Mexico have long been important destinations for U.S. processed products. Exports to most of the United States’ top markets grew in 2021 following a decline in 2020 amid the COVID-19 pandemic. Exports to China and Taiwan both increased significantly, by 23 percent and 37 percent respectively, following small 2020 declines. Strong growth also extended beyond top markets, with exports to all other partners up by a combined $580 million (19 percent).
Drivers
- U.S. trade agreements, such as USMCA and the United States - Korea Free Trade Agreement (KORUS), continue to provide preferential access and maintain the competitiveness of high-value processed foods.
- Total exports of U.S. processed food tend to be stable year-to-year in large part due to the strength and size of the Canadian and Mexican markets. Following a 7-percent decline in exports to Mexico in 2020, demand has recovered with exports far exceeding pre-pandemic levels in 2021.
- Exports of U.S. food preparations, which include various processed ingredients, flavorings, and supplements had the highest growth in 2021, up $758 million to a total of $5.9 billion.
- Exports of U.S. bakery goods, cereals and pasta, condiments and sauces, chocolate and cocoa products, and confectionery all increased in 2021 following declines in 2020 to continue the trend of stable growth in prior years.
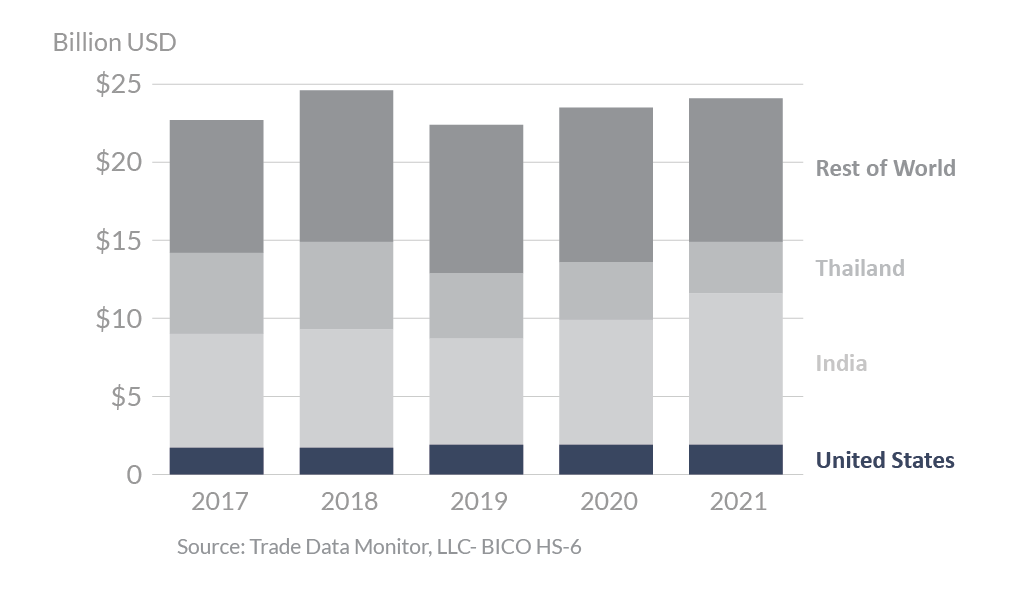
Global Rice Exports
Looking Ahead
The global trade of prepared foods has nearly doubled in the last decade. Demand is driven in large part by income growth and urbanization, both generally leading to increased consumer desire for convenient, shelf-ready packaged foods. Imported prepared foods provide variety for consumers, and often supply producers in domestic processed food sectors. Because world income growth and urbanization are both expected to continue, with rates varying by country, processed food exports will continue to have strong prospects. Currently, the majority of U.S. processed foods are exported to high-income countries like Canada, Mexico, South Korea, and the EU, which have been the largest markets for many years. As income levels around the world have risen in recent decades, the destinations for U.S. products have become more diverse, and much of the growth has come from outside these top markets. Looking ahead, expect more opportunities to appear in more diverse markets demanding the variety of processed foods that the United States can supply.