Philippines 2019 Export Highlights
Top 10 U.S. Agricultural Exports to Philippines(values in million USD) |
|||||||
| Commodity | 2015 | 2016 | 2017 | 2018 | 2019 | % Change 2018-2019 |
5-Year Average 2015-2019 |
| Soybean Meal | 635 | 729 | 747 | 884 | 788 | -11% | 757 |
| Wheat | 516 | 592 | 555 | 643 | 700 | 9% | 601 |
| Dairy Products | 251 | 227 | 243 | 247 | 273 | 11% | 248 |
| Prepared Food | 85 | 89 | 92 | 105 | 111 | 6% | 96 |
| Processed Vegetables | 73 | 72 | 79 | 83 | 110 | 33% | 83 |
| Poultry Meat & Products* | 68 | 77 | 92 | 111 | 102 | -7% | 90 |
| Pork & Pork Products | 80 | 79 | 98 | 116 | 93 | -20% | 93 |
| Beef & Beef Products | 64 | 55 | 62 | 87 | 88 | 1% | 71 |
| Snack Foods | 48 | 63 | 54 | 59 | 60 | 2% | 57 |
| Feeds & Fodders | 35 | 41 | 48 | 64 | 54 | -15% | 48 |
| All Other | 457 | 550 | 512 | 558 | 512 | -8% | 518 |
| Total Exported | 2,310 | 2,573 | 2,581 | 2,956 | 2,892 | -2% | 2,662 |
Source: U.S. Census Bureau Trade Data - BICO HS-10
*Excludes eggs
Highlights
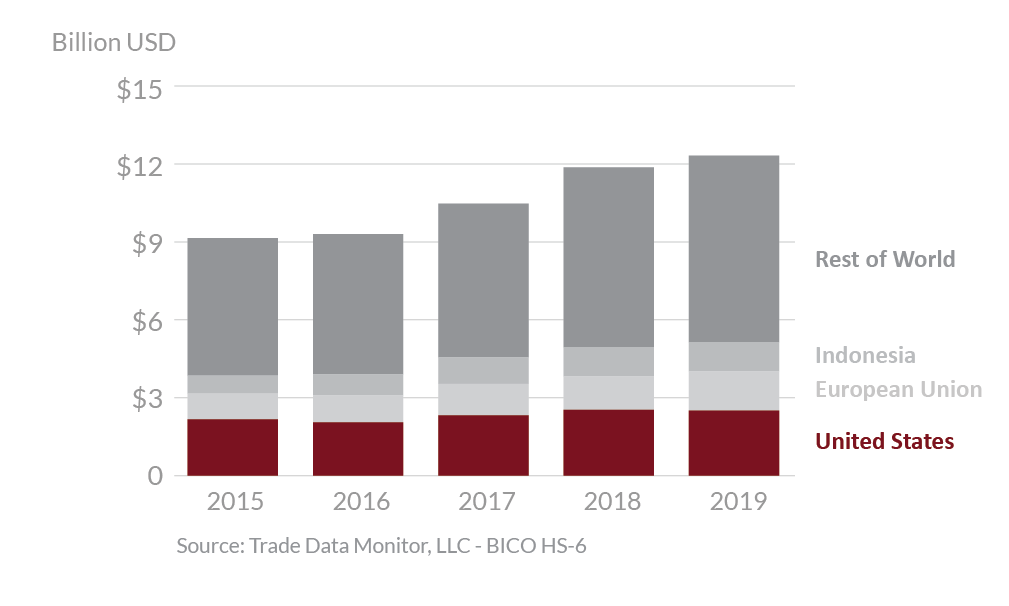
In 2019, Philippines was the tenth largest destination for U.S. agricultural exports, which totaled $2.9 billion, a 2 percent decrease from 2018. The United States is expected to be Philippines’s top supplier of agricultural goods with 21 percent market share, followed by the European Union with 11 percent. The Philippine applied MFN tariffs are among the lowest in the region and often close to the preferential rates offered to U.S. competitors. The largest export increases were seen in wheat and processed vegetables, up $58 million and $28 million, respectively. Additionally, increases in exports of dairy products, distillers’ grains, and prepared foods were up $26 million, $14 million, and $6 million, respectively. Exports of soybean meal were down by more than $96 million. Exports of pork & pork products, corn, and soybeans were down $23 million, $15 million, and $14 million, respectively.
Drivers
-
Soybean meal exports declined by 11 percent over their 2018 values as U.S. prices increased in response to China’s renewed purchases of soybeans from the U.S. and South American competitors improved their competitiveness on the world market.
-
Wheat exports were up 9 percent over the previous year and reached a near record in part due to shorter supplies and decreased competition from Australia, Russia and Canada.
-
Dairy product exports were up 9 percent and at their highest level since 2014 as exports to China were down and more product was available for other Southeast Asian markets.
-
Higher global prices for skim milk powder and cheese also propped up U.S. exports to the region.
-
Exports of pork and pork products were down 20 percent as the ASF outbreak in China raised prices and redirected U.S. product to China to meet drastic shortages.
Philippines's Agricultural Suppliers


Looking Ahead
The Philippines has a young, fast-growing, and highly urbanized population with strong preference for U.S. food and beverage products. The demographics and rising income levels of the Philippines signify a promising market for U.S. consumer-oriented goods such as dairy, tree nuts, prepared foods, beverages and horticultural goods. Certain agricultural products, such as corn, chipping potatoes, pork, and poultry products, face both in-quota and out-of-quota tariffs under the Philippines’ tariff rate quota program known as the Minimum Access Volume system which can present a challenge for U.S. food and agriculture exports.
