
Fresh Fruits and Vegetables 2021 Export Highlights
Top 10 Export Markets for U.S. Fresh Fruits and Vegetables(values in million USD) |
|||||||
| Country | 2017 | 2018 | 2019 | 2020 | 2021 | 2020-2021 % Change | 2017-2021 Average |
| Canada | 3,487 | 3,416 | 3,470 | 3,485 | 3,717 | 7% | 3,515 |
| Mexico | 704 | 760 | 803 | 772 | 982 | 27% | 804 |
| South Korea | 508 | 512 | 419 | 477 | 456 | -4% | 474 |
| Japan | 413 | 427 | 401 | 371 | 373 | 0% | 397 |
| Taiwan | 292 | 278 | 323 | 261 | 267 | 2% | 284 |
| Hong Kong | 302 | 248 | 205 | 189 | 151 | -20% | 219 |
| European Union-27 | 129 | 132 | 124 | 113 | 120 | 6% | 124 |
| China | 226 | 177 | 119 | 112 | 112 | 0% | 149 |
| Vietnam | 72 | 103 | 140 | 138 | 101 | -27% | 111 |
| Australia | 118 | 118 | 112 | 103 | 100 | -4% | 110 |
| All Others | 1,013 | 1,080 | 941 | 873 | 780 | -11% | 937 |
| Total Exported | 7,265 | 7,253 | 7,055 | 6,895 | 7,158 | 4% | 7,125 |
Source: U.S. Census Bureau Trade Data - BICO HS-10
Highlights
In 2021, the value of U.S. fresh fruit and vegetable exports to the world reached $7.2 billion, a 4-percent increase from the prior year. Due to geographic proximity and climate, Canada remained the top U.S. market, accounting for 52 percent of total exports valued at $3.7 billion. Mexico came in a distant second with 14 percent of U.S. exports, while no other markets had more than 6 percent share of exports. U.S. strawberry exports had the largest growth, up $68 million on higher exports to Canada, Mexico, and Saudi Arabia. U.S. apple exports had the second-largest growth, up $62 million on higher exports to Mexico, Taiwan, and Canada. U.S. grape exports experienced the greatest drop, down $61 million from 2020, with the largest losses in South Korea, Hong Kong, and Vietnam. Fruit and vegetable exports to China were unchanged. However, Mexico saw a significant gain of $110 million. Apples, pears, peaches, citrus, table grapes, and cherries continue to make up nearly half of total U.S. fresh fruit and vegetable exports.
Drivers
- Top fresh fruit export commodities included apples, grapes, oranges, strawberries, and cherries, which accounted for a combined $3.1 billion, with top markets including Canada, Mexico, South Korea, Japan, and Taiwan.
- Top fresh vegetable export commodities included lettuce, potatoes, sweet potatoes, onions/shallots, and cauliflower, which accounted for a combined $1.1 billion, with top markets including Canada, Mexico, and the EU.
- India imposed a 20 percent retaliatory tariff on U.S. apples in June 2019, bringing the total tariff rate to 70 percent. This tariff remains in place.
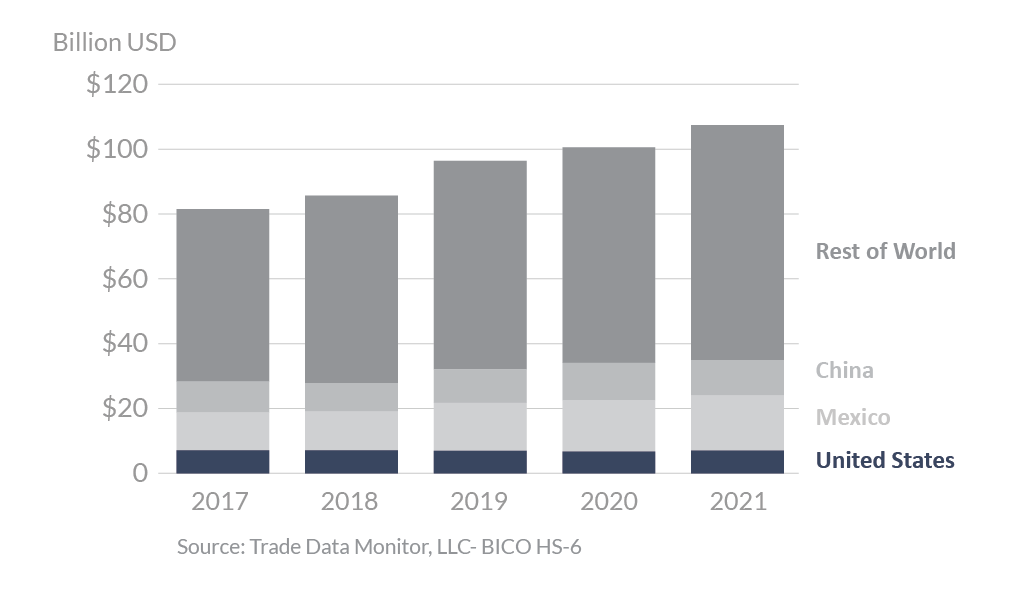
Global Fresh Fruit and Vegetable Exports
Looking Ahead
U.S. apple production is forecast to decline due to weather-damaged crops in Washington and Michigan. U.S. apple production is forecast to increase on a rebound in the top-producing state, Washington. Greater supplies are expected to raise exports, especially to top markets Mexico and Canada. U.S. table grape production is expected to see a modest recovery, rising above 900,000 tons. Despite improved supplies, exports are expected to decrease on reduced shipments to most top markets. U.S. orange production is forecast to drop 11 percent to a near record low of 3.6 million tons, due to poor fruit set in California and the continued decline in area and yields in Florida as a result of citrus greening. Exports are forecast to be down with the lower production. Rebounding cherry production is forecast to lift exports, halting a three-year decline. New growth markets for fresh fruit and vegetables include the Dominican Republic, Kuwait, and Peru. Over the last 10 years, the growth rate for fresh vegetables has been trending up on the strength of shipments to Canada, Mexico, and the EU, while fresh fruit exports continue to decline from their 2013 peak, primarily due to lower table grape, apple, and orange production.