
Egypt 2021 Export Highlights
Top 10 U.S. Agricultural Exports to Egypt(values in million USD) |
|||||||
| Commodity | 2017 | 2018 | 2019 | 2020 | 2021 | 2020-2021 % Change | 2017-2021 Average |
| Soybeans | 364 | 1,164 | 995 | 1,444 | 1,434 | -1% | 1,080 |
| Corn | 23 | 320 | 0 | 8 | 110 | 1343% | 92 |
| Dairy Products | 35 | 30 | 45 | 76 | 106 | 39% | 59 |
| Beef & Beef Products | 72 | 66 | 77 | 57 | 74 | 30% | 69 |
| Wheat | 34 | 24 | 180 | 25 | 68 | 171% | 66 |
| Feeds, Meals & Fodders | 70 | 84 | 76 | 59 | 56 | -6% | 69 |
| Vegetable Oils* | 47 | 34 | 31 | 37 | 47 | 29% | 39 |
| Distillers Grains | 22 | 39 | 28 | 36 | 44 | 24% | 34 |
| Tree Nuts | 10 | 23 | 32 | 51 | 41 | -19% | 32 |
| Cotton | 36 | 55 | 31 | 28 | 21 | -25% | 34 |
| All Others | 55 | 74 | 61 | 75 | 56 | -24% | 64 |
| Total Exported | 769 | 1,914 | 1,556 | 1,895 | 2,057 | 9% | 1,638 |
Source: U.S. Census Bureau Trade Data - BICO HS-10
*Excludes soybeans
Highlights
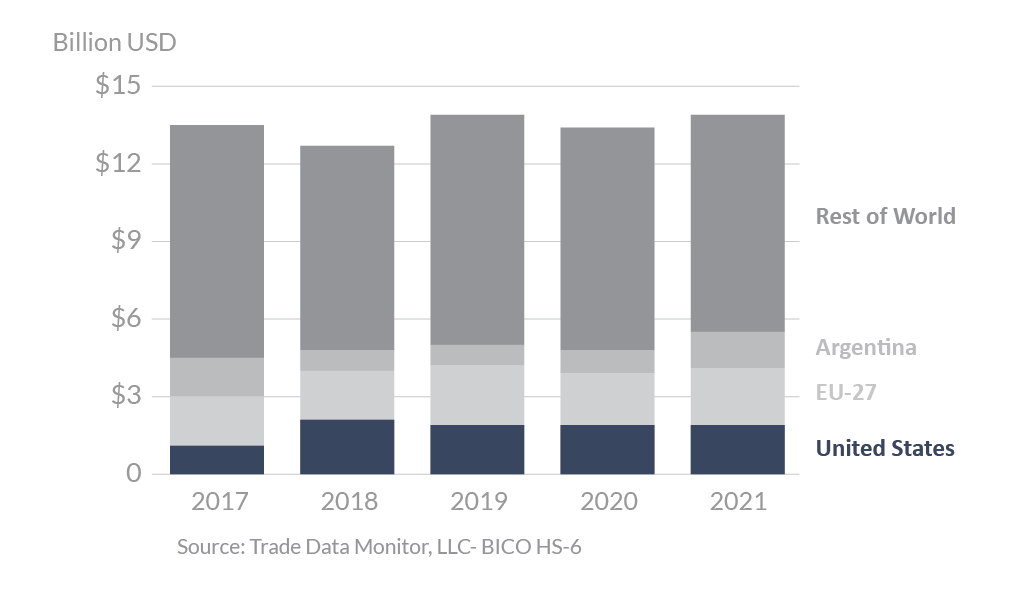
In 2021, Egypt was the 13th-largest destination for U.S. agricultural exports by value, totaling $2.1 billion. This represents a 9-percent increase from 2020, a total gain of $162 million. The United States is the second largest agricultural supplier to Egypt with 14-percent market share, just behind the EU with 15-percent market share. Exporters from the United States face competition from EU Member States which have a geographical advantage, lower shipping rates, and a free trade agreement which provides preferential tariffs to EU-origin products. The largest export growth for the United States was seen in corn up $102 million in 2021. Exports of wheat grew from $25 million in 2020 to $68 million last year, while dairy products increased 39 percent to $106 million. Meanwhile, exports of soybean oil were down $23 million. Exports of cotton and soybeans fell by $10 million each.
Drivers
- In 2021, U.S. soybean exports fell 1 percent from the 2020 record-breaking $1.4 million due to lower processing margins and consumer demand. Overall Egypt import volume was down 25 percent from all markets. During the 2019/2020 marketing year, U.S. soybean exports overall were record-breaking, and the United States remains the preferred supplier for Egypt’s soybean imports.
- Corn exports increased substantially from 2020 with $102 million increase. Egypt is a net importer of soybeans and corn to meet the feed demand of its growing poultry and aquaculture sectors.
- U.S. wheat saw a 171-percent increase from 2020 to $68 million in 2021, even though global imports were down 10 percent, a $225 million decrease from 2020.
- U.S. beef exports increased by $17 million (30 percent from 2020) partly thanks to Egypt’s adoption of a risk-based approach to establishing veterinary drug standards. This allowed beef, particularly beef livers, to recover from 2020’s lower value.
- In 2021, U.S. tree nut exports to Egypt decreased by $10 million, compared to 2020, which represented a record. Despite this dip, 2021 was still the second largest import year by value.
- U.S. exports of dairy products have been growing steadily in recent years to reach $106 million in 2021. This growth has been driven by exports of skimmed milk powder and whey and whey products. Egypt is not self-sufficient in dairy products and will continue to rely on dairy imports to supplement domestic milk production.
Egypt’s Agricultural Suppliers
Looking Ahead
In 2020, the Government of Egypt responded decisively and quickly with poverty alleviation and public assistance programs to mitigate commercial and household impacts due to COVID-19. Egypt’s agricultural trade outlook remains dependent on a global recovery to restart its tourism and energy sectors, major drivers of its national economy. In 2021, Egyptian purchases of U.S. food and agricultural products rose 9 percent from 2020 driven by higher demand for dairy products, beef products, vegetable oils, wheat, and dried distillers’ grains with solubles (DDGS). In 2021, Egypt resumed wheat imports as national production fell short, it saw surging demand due to continued population growth, and pasta was included in the national food subsidy program. Meanwhile, processors also responded to lower margins and inflationary market conditions by substituting intermediate products and ingredients for lower cost alternatives. For example, feed users switched from domestically processed formulations using imported corn and soybeans to imported DDGS. Meanwhile, lower domestic soybean crushing volumes in 2021 drove consumptions of alternative vegetable oils higher. Lastly, many Egyptian processors, traders, and distributors carried over inventories of staple commodities like corn and tree nuts from 2020 into 2021 further diminishing U.S. exports to Egypt in 2021.
Challenges facing U.S. exporters of agricultural products to Egypt include a lack of transparency and science-or-rules-based administration of its customs, sanitary and phytosanitary requirements, halal certification, and import licensing policies. Egypt restricts poultry imports to whole, frozen birds, effectively banning imports of frozen poultry parts and offal. In addition, Egypt recently adopted a single halal certifier for halal products shipped from the United States, raising regulatory costs, and restricting national supplies. Egypt continues to block market access for U.S. seed potatoes. In addition, several U.S. agricultural products – including retail packaged products, pet foods, apples, and pears – face higher tariffs than comparable products from the EU. Egypt signed an Association Agreement with the EU, which entered into force in 2004, and which grants duty-free access for most EU-origin agricultural products