
Egypt 2020 Export Highlights
Top 10 U.S. Agricultural Exports to Egypt(values in million USD) |
|||||||
| Commodity | 2016 | 2017 | 2018 | 2019 | 2020 | 2019-2020 % Change | 2016-2020 Average |
| Soybeans | 100 | 364 | 1,164 | 995 | 1,475 | 48% | 820 |
| Dairy Products | 29 | 35 | 30 | 45 | 77 | 69% | 43 |
| Feeds & Fodders | 79 | 70 | 84 | 78 | 59 | -24% | 74 |
| Beef & Beef Products | 99 | 72 | 66 | 77 | 57 | -26% | 74 |
| Tree Nuts | 32 | 10 | 23 | 32 | 51 | 59% | 30 |
| Vegetable Oils* | 51 | 48 | 34 | 31 | 37 | 18% | 40 |
| Cotton | 34 | 36 | 55 | 31 | 28 | -11% | 37 |
| Wheat | 20 | 34 | 24 | 180 | 25 | -86% | 57 |
| Soybean Oil | 13 | 0 | -- | 0 | 23 | -- | 7 |
| Corn | 153 | 23 | 320 | 0 | 8 | -- | 101 |
| All Other | 131 | 78 | 114 | 89 | 90 | 1% | 100 |
| Total Exported | 741 | 770 | 1,914 | 1,558 | 1,930 | 24% | 1,383 |
Source: U.S. Census Bureau Trade Data - BICO HS-10
*Excludes soybeans
Highlights
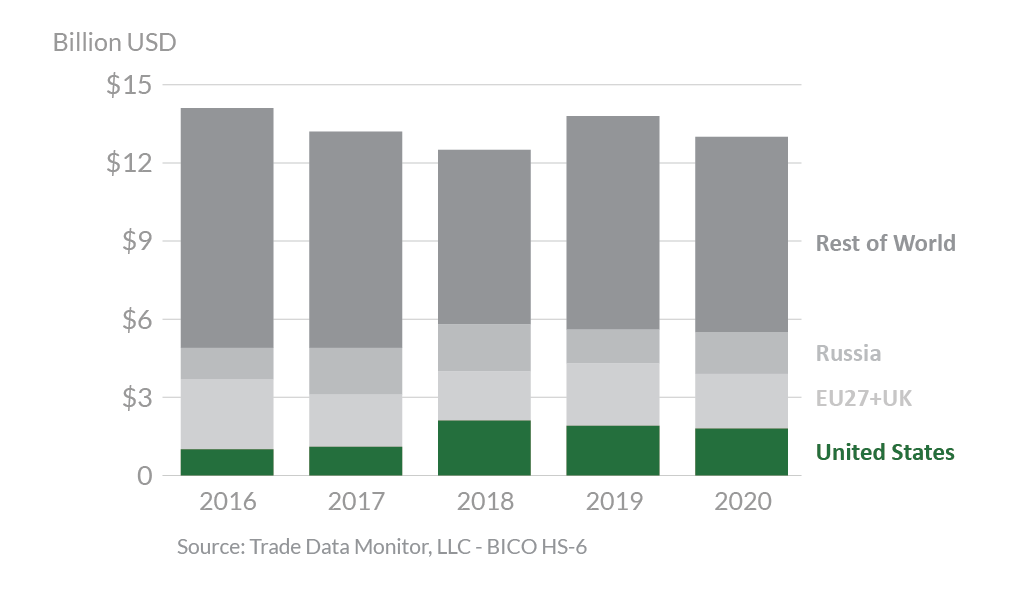
In 2020, Egypt was the 13th largest destination for U.S. agricultural exports by value, totaling $1.9 billion. This represents a 24-percent increase from 2019. The United States is the second- largest agricultural supplier to Egypt with 14 percent market share, just behind the EU27+UK with 16 percent market share. Exporters from the United States face competition from the European Union Member States which have a geographical advantage, lower shipping rates, and a free trade agreement which provides preferential tariffs to EU-origin products. The largest export growth for the United States was seen in soybeans and dairy products, up $480 million and $32 million, respectively. Exports of soybean oil grew from $0 in 2019 to $23 million last year, while tree nut shipments increased 59 percent to $51 million annually. Meanwhile, exports of wheat were down more than $150 million. Exports of feeds & fodders and beef & beef products fell by $19 million and $20 million, respectively.
Drivers
- Soybean exports in 2020 reached a record $1.5 billion, up $480 million from 2019. U.S. soybeans benefitted from expanded local crushing capacity in Egypt.
- After falling 17 percent in 2019, U.S. soybean exports to Egypt recovered in 2020 to a historical record, rising to become the third-largest global market.
- Egypt imported less wheat from the United States in 2020 after record imports of $180 million the year before due to a higher price gap between U.S. origin and other suppliers and an uptick in global export prices during the early stages of the COVID-19 pandemic.
- Growth in the processing and retail sectors continued to spur imports of consumer-oriented goods such as beef, dairy, and tree nuts.
Egypt’s Agricultural Suppliers
Looking Ahead
Egypt boasted strong macroeconomic fundamentals prior to the COVID-19 pandemic with strong economic growth and a rapidly growing middle class. As part of its pandemic response, Egypt raised public spending and tapped international debt markets. Egypt’s agricultural import market outlook remains dependent on the global recovery from COVID-19. In 2019, tourism to Egypt led vibrant import growth for higher value consumer goods such as beef & beef products and dairy products. Egypt’s Hotel, Restaurant, and Institution sector is forecast to grow by 15-20 percent in 2021 as tourism continues to rebound following years of political unrest and public security concerns.
With high population growth, Egypt continues to rely on imports for more than 50 percent of its food and agricultural product needs. With limited agricultural resources, low agricultural productivity, and a rapidly growing population, Egypt is the world’s largest wheat importer. Egyptian officials prioritize food security and maintain one of the world’s largest food subsidy programs. Approximately 71 million of Egypt’s population, or about two-thirds, are beneficiaries of the country’s bread subsidy program. Egypt imported less wheat from the United States in 2020 after record imports of $180 million the year before as domestic production recovered from a serious drought and importers responded to higher global export prices during the early stages of the COVID-19 pandemic. Egypt’s General Authority for Supply Commodities (GASC) has 15 approved origin countries for wheat imports, of which Russia was the largest supplier by a wide margin last year at $1.6 billion in total value. Russia’s near-record wheat harvests in 2020, combined with the depreciation of the ruble against the dollar, resulted in record purchases by the GASC. Ukraine was Egypt’s second-largest wheat supplier in 2020 at $688 million in value. In 2021, Egypt’s overall demand for imported wheat is forecast higher based on population growth and the inclusion of pasta in the food subsidy program.
Challenges facing U.S. exporters of agricultural products to Egypt include a de-facto ban on poultry parts, with imports restricted to whole, frozen birds. In addition, Egypt only recognizes one U.S.-based halal certifier, which limits access and increases the cost for halal-certified products. Although Egypt remains the largest market for U.S. frozen beef livers, Egypt historically followed EU-based standards for maximum residue levels (MRLs) for ractopamine in beef products and mandatory testing, which restricted trade. In 2020, Egypt undertook a review of the safety of ractopamine. The United States continues to work with Egypt to implement MRLs consistent with international standards. Egypt continues to block market access for U.S. seed potatoes. In addition, several U.S. agricultural products – including retail packaged products, pet foods, apples, and pears – face higher tariffs than comparable products from the EU. Egypt signed an Association Agreement with the EU, which entered into force in 2004, and which grants duty-free access for most EU-origin agricultural products.
The devaluation of the Egyptian pound and inflationary pressure on food prices have driven consumers to lower-priced, locally produced, consumer-oriented products. This has led to an expansion of the Egyptian food-processing sector, and increased imports of food and beverage ingredients and additives to support the growing sector.