Diary 2019 Export Highlights
Top 10 Export Markets for U.S. Dairy(values in million USD) |
|||||||
| Country | 2015 | 2016 | 2017 | 2018 | 2019 | % Change 2018-2019 |
5-Year Average 2015-2019 |
| Mexico | 1,280 | 1,218 | 1,312 | 1,398 | 1,546 | 11% | 1,351 |
| Canada | 554 | 630 | 637 | 641 | 666 | 4% | 626 |
| China | 451 | 386 | 576 | 499 | 374 | -25% | 457 |
| South Korea | 306 | 231 | 279 | 291 | 332 | 14% | 288 |
| Japan | 273 | 206 | 291 | 270 | 283 | 5% | 265 |
| Philippines | 251 | 227 | 243 | 247 | 273 | 11% | 248 |
| Indonesia | 183 | 158 | 132 | 166 | 240 | 45% | 176 |
| Vietnam | 168 | 120 | 112 | 145 | 171 | 18% | 143 |
| Australia | 137 | 109 | 185 | 154 | 149 | -3% | 147 |
| Colombia | 55 | 88 | 65 | 73 | 145 | 100% | 85 |
| All Others | 1,581 | 1,326 | 1,545 | 1,616 | 1,753 | 9% | 1,564 |
| Total Exported | 5,240 | 4,698 | 5,377 | 5,498 | 5,931 | 8% | 5,349 |
Source: U.S. Census Bureau Trade Data - BICO HS-10
Highlights
U.S. dairy product exports grew by 8 percent to reach $5.9 billion in 2019 despite a turbulent year marked by trade policy issues and the impact of ASF which reduced export demand for U.S. shipments of whey products and lactose. This was the third year in a row that the value of U.S. dairy product exports expanded, registering an average annual growth rate of 8 percent. Mexico, Canada, and China are the top three markets, accounting for about 44 percent of sales. Southeast Asia remains a critical region for growth, with the value of dairy shipments up an impressive 22 percent over 2018. Exports to South America also grew at an impressive pace with exports to this region rising by 34 percent.
Drivers
-
Higher global prices contributed to the increase in the value of Skim Milk Powder (SMP) and cheese exports which grew by 23 percent and 6 percent respectively, despite a decline in volumes exported.
-
Shipments of dairy products to China fell by 44 percent relative to 2018 due to the imposition of retaliatory tariffs and the impact of ASF. The losses were particularly acute for exports of SMP and whey products which fell by over 50 percent.
-
Nearly 60 percent of U.S. dairy products were exported to Free Trade Agreement partner countries. The value of shipments to these countries grew by 11 percent, although volumes contracted slightly.
-
Among FTA partners, the value of exports to the top three markets – Mexico, Canada, and South Korea – grew by 9 percent. Exports to Colombia doubled to $145 million, while volumes grew by 72 percent.
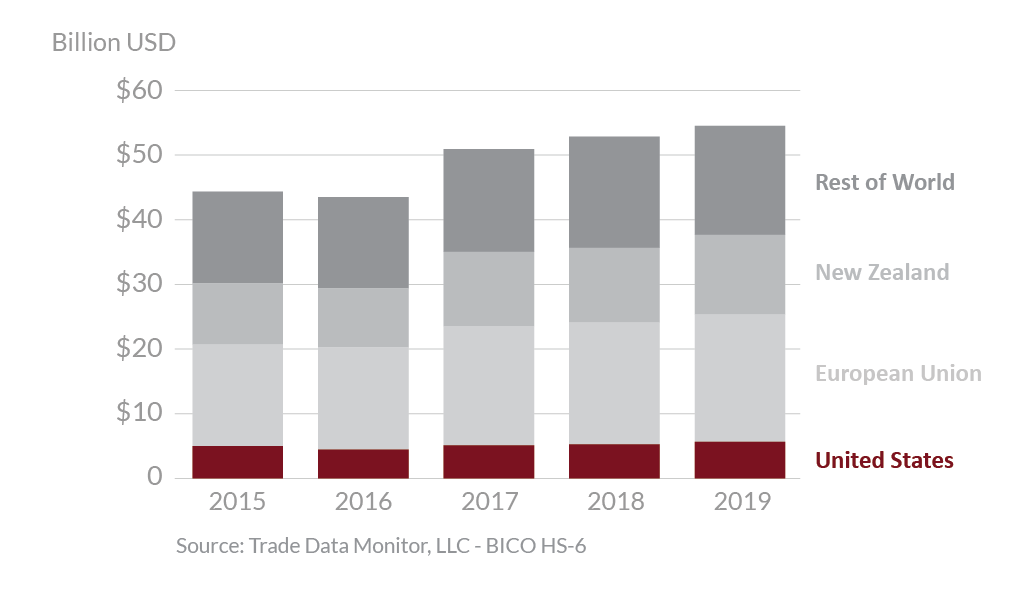
Global Dairy Exports

Despite ongoing trade policy challenges, particularly with respect to China and the uncertainties brought on by the emergence of the coronavirus, the outlook for 2020 is positive. In the trade policy arena, the Phase One agreement with China will create more opportunities for U.S. exports. Further, the United States-Mexico-Canada Agreement is expected to be implemented thus providing additional access to the Canadian market, while the U.S.-Japan Trade Agreement signed in September 2019 will mean that U.S. dairy exports will be on a competitive level playing field with other dairy exporting countries such as Australia, New Zealand and Canada. Looking at the fundamental supply and demand situation, U.S. dairy product exports are poised to post substantial gains in 2020. Import demand for dairy products remains strong in developing economies driven by higher per capita incomes and an expanding middle class.
China is expected to start rebuilding its swine herd which will likely lead to higher imports of whey products and lactose. On the supply side, the global outlook points to more limited supplies as evidenced by rising prices of SMP, cheese, and whey products. Milk production in Australia is forecast to contract, while the pace of milk production growth in New Zealand and the EU is expected to slow. This leaves the United States as the leading exporter capable of filling any supply gaps. For 2020, U.S. exports on a milk fat equivalent basis are forecast to grow by 2 percent while shipments on a skimmed milk equivalent basis are expected to expand by 5 percent.
