Southeast Asia: Historical El Niño-Related Crop Yield Impact
Contact:
The world’s major meteorological organizations have issued alerts about the increasing probability of an El Niño event. Sea-surface temperatures (SST) from March through May have begun to rise in the eastern and central Pacific ocean. In early June, climate scientists at the National Oceanic and Atmospheric Administration (NOAA) reported a 70-percent chance of El Niño forming this summer. Historically, Southeast Asian countries see significant climate-related problems with El Niños, with India, Indonesia, Philippines, and Australia often experiencing deficient rainfall or drought. Given the region’s extremely large population, its significant economic dependence on agriculture, and the preponderance of small-scale subsistence farms , any potential climatic threats to agricultural yields may have implications for regional food security. The early warning provided by climate scientists this year enabled governments throughout the region to discuss and implement El Niño-related contingency plans. This article describes the impact that El Ninos have had on major crop production in the region, focusing on the primary foodgrain, feedgrain, and oilseed crops (rice, corn, and palm oil).
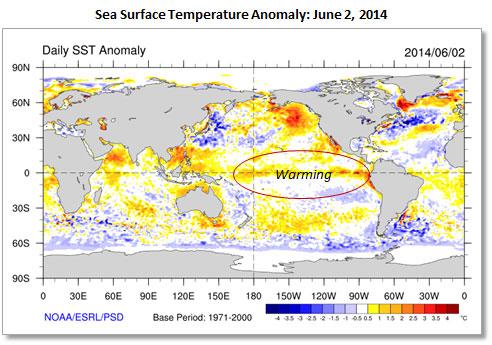

The El Niño climate phenomenon in the West Pacific region typically means cooling sea-surface temperatures (SSTs), weaker seasonal tradewinds, and lower convective activity in the atmosphere--all of which affect the general rainfall pattern. Cooler ocean temperatures suppress, to varying degrees, cloud formation, tradewinds, and the energy available for storm systems, including tropical cyclones. The net result is a drier-than-normal rainfall pattern over parts of Southeast Asia, with Indonesia and the Philippinesusually experiencing the worst conditions.
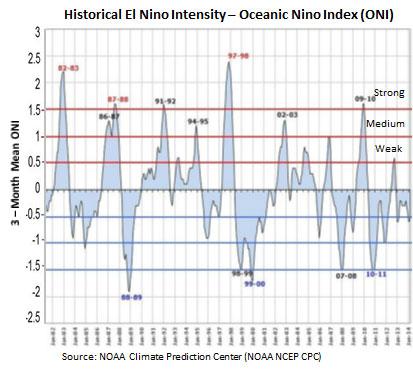
El Niño events occur fairly regularly, but each is unique in the degree to which they influence rainfall patterns and agricultural production. For example, there have been 10 documented El Niño’s between 1980-2013, with an average occurrence of one every 3.5 years. NOAA reports 3 strong, 5 moderate, and 2 weak El Niño episodes during this 34-year period. The graph above from NOAA displays the actual variation in the intensity of the events over time.
The regional-scale crop response in Southeast Asia to these 10 historical El Niño’s varied, as seen in the graphs below. Not only is there a wide range in the effect on crops, but there appears to be no relationship between the regional crop yield and the severity of the El Niño event. The reasons for this are likely related to the variation in when the which month El Niño starts, how long it lasts (how many crop seasons/cycles are impacted), and which countries are affected most. The conclusions drawn from this data point us to a general expectation for variable crop yields during El Niño’s, but not necessarily to a substantially negative outcome for the region as a whole. Therefore, it should not be assumed that the development of El Niño implies major food grain, feed grain, or edible oil shortages throughout Southeast Asia.
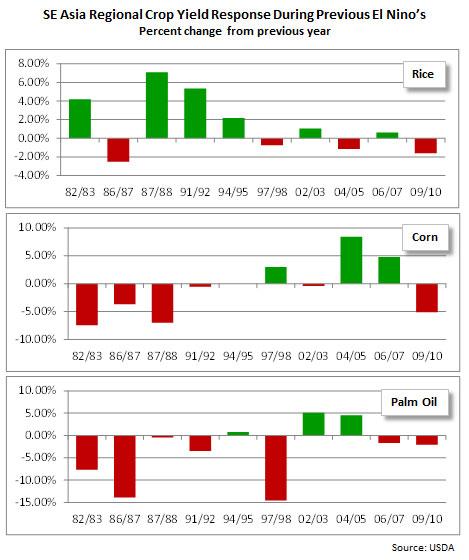
However, Indonesia and the Philippines, for example, have strong correlations between El Niño and crop reductions. Both of these countries experienced considerable drought and heat waves during many past El Niño’s, which have led to declines in annual rice and corn production, and in some cases to reductions in palm oil output.
The table below illustrates the actual crop yield impacts experienced during the last moderate El Niño in 2009/10. The percent change is relative to the yield recorded in the previous year (2008/09). These 3 main food, feed, and oilseed crops are grown throughout the year, with rice and corn having several distinct growing seasons. Spreading the production risk over multiple periods in the year, as well as the ability to supplement rainfall with irrigation supplies, has enabled farmers to become more resilient in the face of climatic variation.
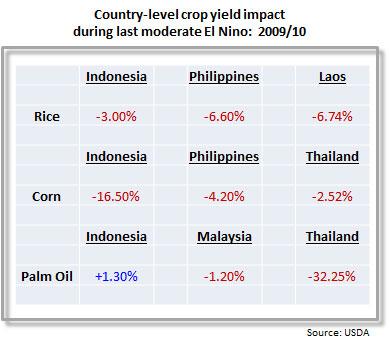
Drought still poses the most significant threat to overall production and food security, given the majority of rice and corn varieties preferred by famers are sensitive to drought stress. The International Rice Research Institute (IRRI) estimated in 2002 that only 45 percent of total rice area cultivated in Southeast Asia was irrigated, leaving the majority susceptible to periodic drought or rainfall deficiencies. The vast majority of irrigation reserves are found in Indonesia, Vietnam, Thailand, and the Philippines.
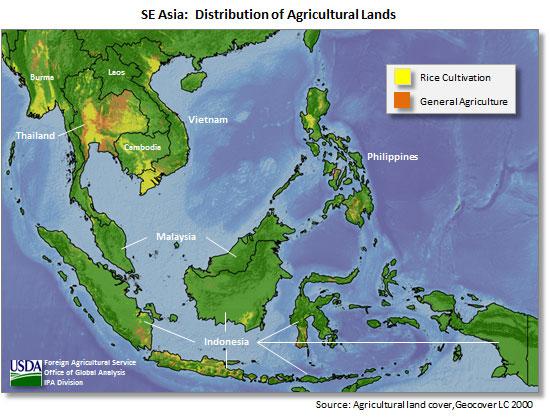
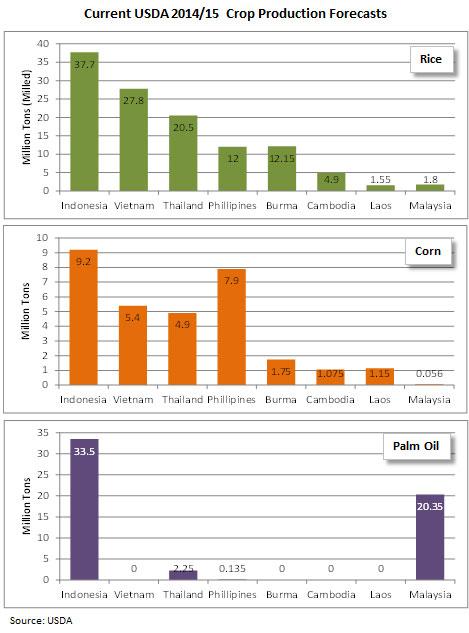
The 2014 event is not projected to fully form until late summer. If this forecast holds, then major wet season rice and corn crops across the region may ultimately escape its worst impacts. These crops are typically harvested in the September-November period in countries like Burma, Thailand, Cambodia, Laos, Vietnam, and the Philippines. Dry season rice and corn crops, as well as palm oil, will become more vulnerable if El Niño develops and persists from October 2014-April 2015, with Indonesia and the Philippines being especially prone to drought-related crop stress and yield declines. As of June 2014, USDA forecasts 2014/15 Southeast Asian milled rice, corn, and palm oil production at record levels of 118.4, 31.4, and 56.2 million tons, respectively. There has been strong trend yield growth over the past 10-15 years in these commodities.
USDA crop production estimates by commodity and by country for Southeast Asia are in the charts below.
Agricultural attaché reports can be queried at the FAS web site. USDA global area and production estimates for grains and other agricultural commodities are available on the USDA/FAS Global Crop Production Analysis page, or at PSD Online.
