
Browse Data and Analysis
Filter
Search Data and Analysis
- 63 results found
- (-) Charts and Graphs
- Clear all
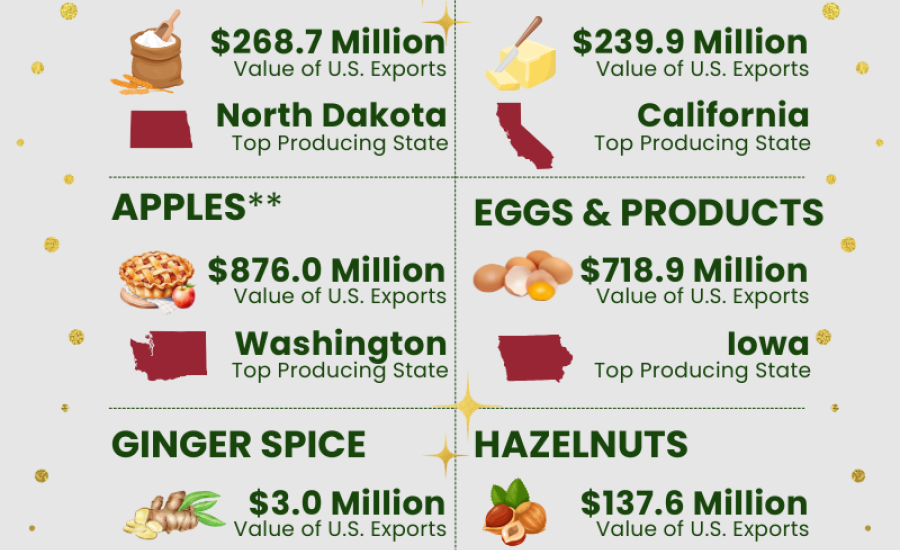
Infographic discussing holiday baking as it relates to 2022 U.S. agricultural export totals and top producing states.
Infographic showing a series of Halloween themed trivia questions related to U.S. agricultural exports.

Infographic highlighting Foreign Agricultural Service accomplishments in 2022.

FY2022 agricultural exports reach record levels.

FY2021 agricultural exports reach record levels.

A look at how U.S. agricultural exports performed in 2020.
Infographic detailing FAS 2019 accomplishments in the areas of trade policy, market development, and trade capacity building.

Infographic looking at U.S. agricultural trade with Panama which saw $683 million in agricultural exports from the U.S. in 2018.
Stacked column chart illustrating the growth of U.S. agricultural exports to FTA partners verses a decrease in exports to non-FTA partners.
Graphic showing the top markets for U.S. ag exports in 2018. Canada was the top market, followed by Mexico and the European Union.
World Trade Month infographic highlighting key numbers for 2018 U.S. agricultural exports.
Infographic detailing some of the FAS 2018 accomplishments in the areas of trade policy, market development, and trade capacity building.