
Opportunities for U.S. Feed Ingredients and Processed Products in Kenya
Contact:
Link to report:
Executive Summary
Kenya’s strategic geographical location and growing middle class makes it an economic, financial, and transport hub for East and Central Africa. Agriculture remains the main contributor to the economy with approximately 75 percent of the 54.7 million population working fully or partially in the agriculture sector. However, high fertilizer prices, small rain-fed fields, and low productivity are obstacles to increasing domestic supply while Kenya’s growing population, increasing urbanization, and growing incomes will spark higher demand for imported food. Among other things, urban migration and the recovery of Kenya’s tourism sector (post-pandemic) will provide ample market opportunity for a variety of agricultural imports including feed ingredients and processed products, though there are still trade barriers to consider.
Macroeconomic Overview
In 2020, Kenya’s gross domestic product (GDP) per capita was $4,340. This GDP per capita reflects a 5 percent annual increase from 2016 to 2020, according to the World Bank. IHS Markit projects a 27 percent increase in GDP per capita to $5,522 from 2020 to 2025. According to IHS Markit, Kenya’s population demographic consists of a median age of 20 years, and the urban population made up 28 percent of the total population in 2020 and is forecast to be 31 percent of the total population in 2025.
In the World Bank’s Ease of Doing Business Ranking, Kenya jumped to the 56th spot in 2019, up from 82nd in 2009. This progress exhibits how it offers competitive advantages for industries and corporations looking to do more business in the international market. More information on the improvement of the business sector in Kenya is available in the International Agricultural Trade Report published in February of 2022.
Product Growth and Consumer Habits
Feed Grains
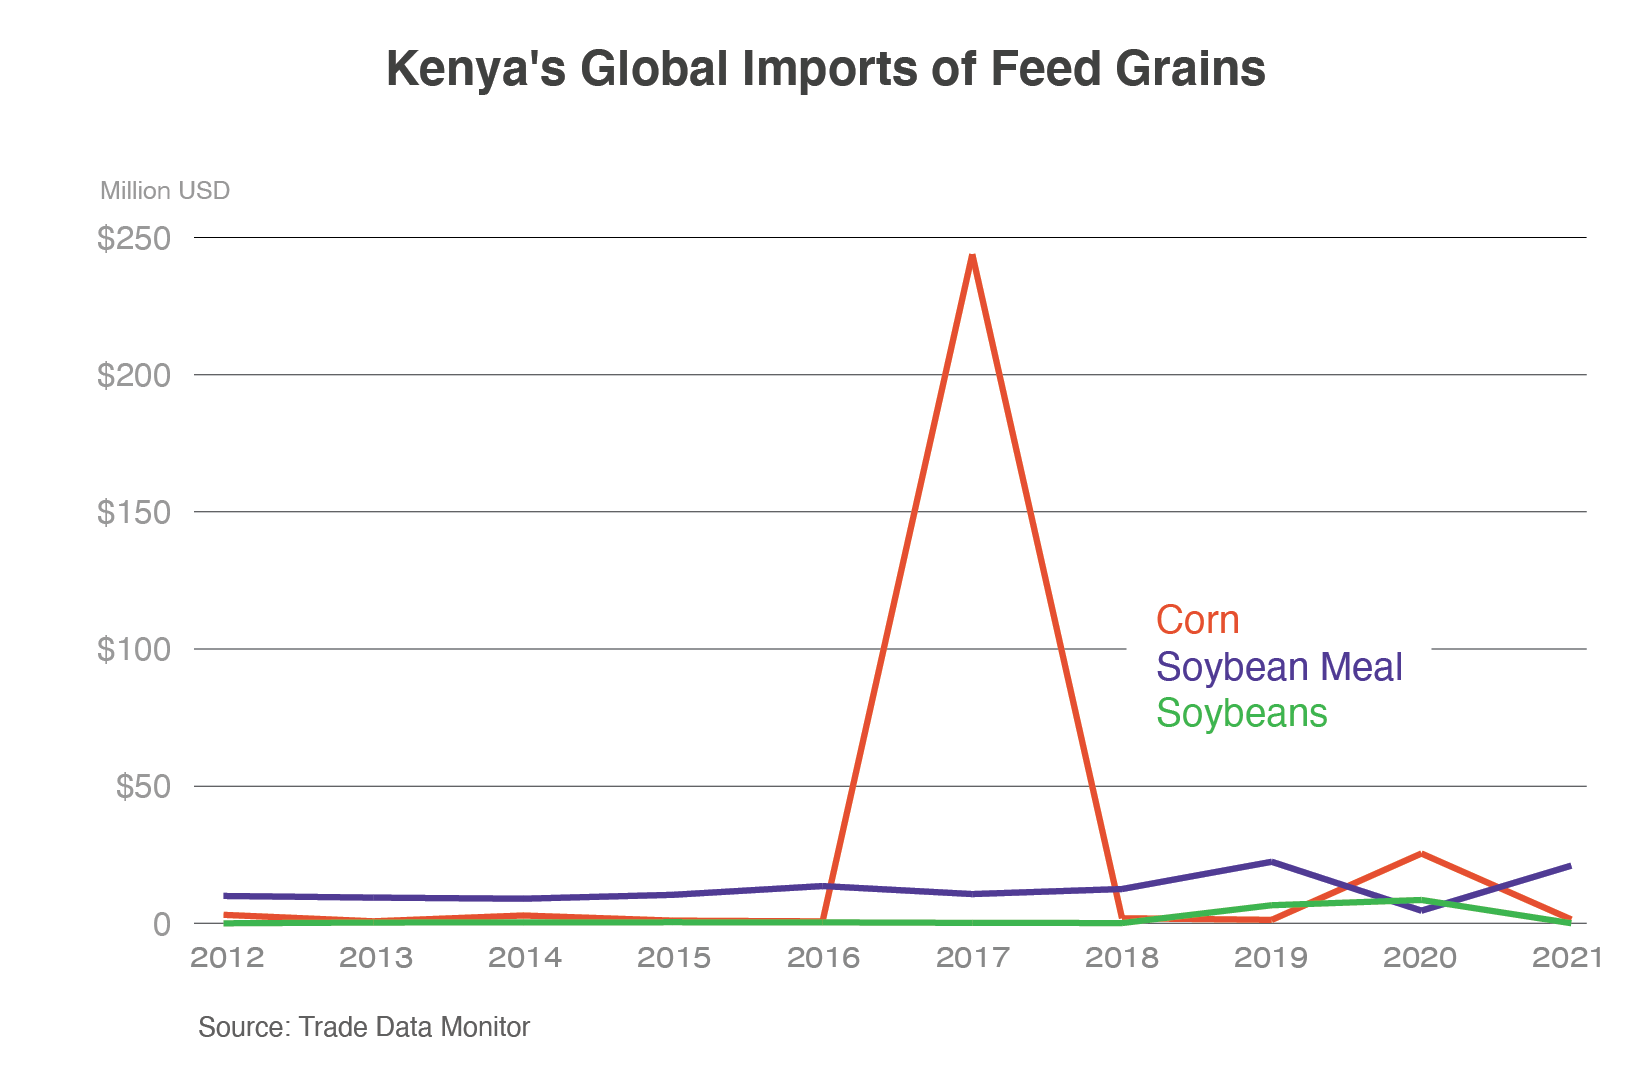
Kenya Imports (Million USD)
| 2012 | 2013 | 2014 | 2015 | 2016 | 2017 | 2018 | 2019 | 2020 | 2021 | |
| Soybeans | 0.00 | 0.28 | 0.34 | 0.39 | 0.34 | 0.16 | 0.09 | 6.58 | 8.51 | 0.03 |
| Soybean Meal | 9.97 | 9.36 | 8.96 | 10.38 | 13.58 | 10.65 | 12.49 | 22.43 | 4.61 | 21.01 |
| Corn | 3.08 | 0.73 | 2.85 | 0.97 | 0.71 | 243.89 | 1.85 | 1.24 | 25.45 | 1.41 |
The price of corn flour in Kenya doubled during 2017 as a result of the previous years’ drought and stock shortages. Large quantities of corn were imported to drive down the price and to supplement domestic production. It is best to look at a 10-year history for major feed grains because of the outlier year of 2017, where corn imports skyrocketed. From 2012 to 2021, soybeans, soybean meal, and corn have seen a 72 percent increase. Soybean meal has had the most consistent growth and is expected to increase further as livestock capacity increases. Grains for feed are mostly domestically produced. However, as the price of feed production increases, Kenya is expected to look outside of domestic products to supplement demand. In 2021, soybean meal reached its second-highest imports in history at $21.0 million, a 97 percent increase from 2017. Soybean imports have been minimal and volatile but offer potential. Over the past five years, imports have ranged between $30.0 thousand (2021) to $8.5 million (2020) with million-dollar soybean imports coming from Ukraine.
The majority of grain imports have been for human consumption with priority interest in white, non-GE corn. Most feed products are by-products of processing in Kenya. However, according to the December 2021 GAIN report (Report Number: KE2021-0019), the Government of Kenya (GoK) announced that key animal feed ingredients (yellow maize, soybeans, soy meal, cottonseed cake, sunflower seed cake, white sorghum, and fish meal) would be exempt from import duties in an effort to curb rising feed prices. It should be noted that these duty exemptions only apply to non-GE products. Currently, East Africa is experiencing one of the worst droughts in over 40 years, raising expectations of increased imports of grains. Dependency on imports for Kenya and other Eastern African Community (EAC) members will increase as drought continues to worsen due to climate change.
Select Processed Products
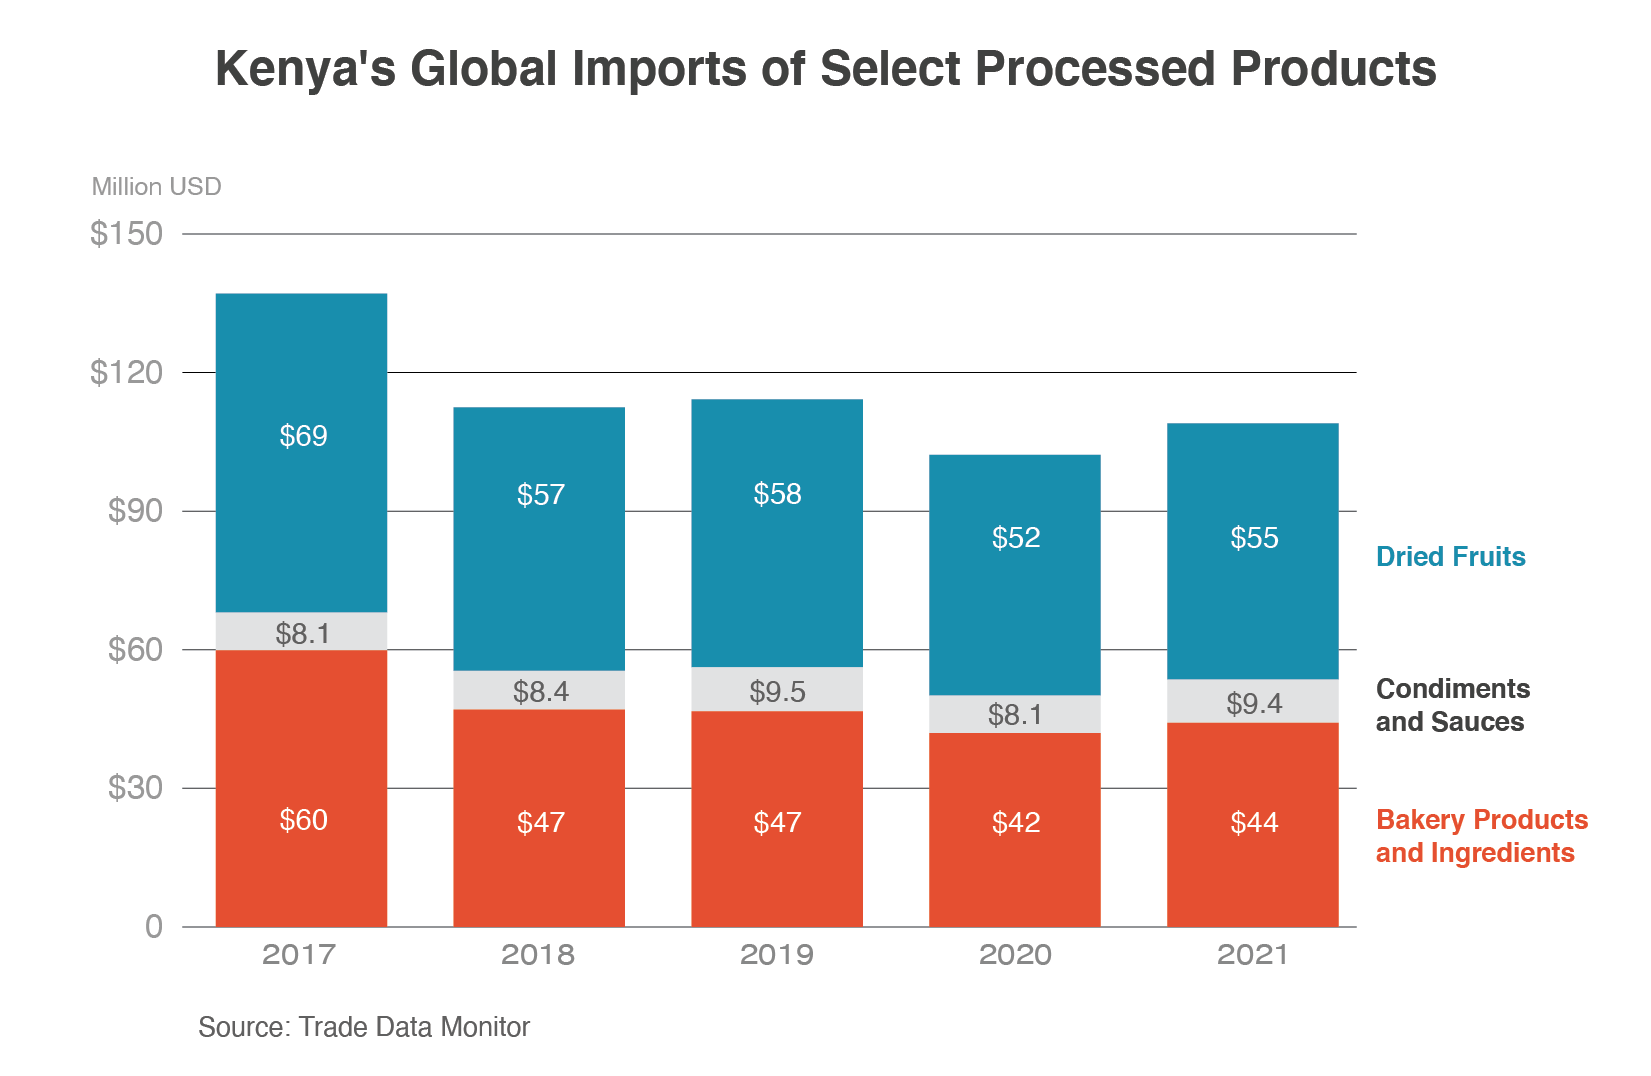
As a country with strong legal institutions and access to sound financial firms, this gateway to East Africa is well positioned to expand imports of convenience foods and ingredients for the manufacturing of domestic processed foods. In 2021, the United States was behind China, Indonesia, Egypt, and South Africa for exports of condiments and sauces. The United States held an 11 percent market share in 2021 (a $1.1 million value). Bakery products and ingredients are the largest imports out of these three products (Dried Fruits, Condiments & Sauces, and Bakery Products & Ingredients) with a five-year average value of $47.9 million. In that same time, imports have decreased by 7 percent as Kenya’s processing capacity increased. Brand recognition will be key to increasing processed product exports as incomes rise and the middle class expands. Dried fruits saw a 17 percent growth over the past five years with a 93 percent increase in imports from 2012 ($980.1 thousand) to 2021 ($1.9 million). The top three dried fruit imports for Kenya are dates, grapes, and figs, thanks to their connection with cultural and religious preferences in the area.
Trade Policy
Since 2012, Kenya has banned genetically engineered (GE) foods and feed products, severely limiting Kenya’s access to U.S. products such as corn, soy, and distiller grains with solubles (DDGS). Kenya has commercialized only one GE crop, Bt. cotton1 which is in the early stages of adoption among Kenyan farmers. Bt. maize is awaiting approval in Kenya’s cabinet after completing all required trials. Despite the ban, Kenya has continued domestic research for GE crops, which have struggled to receive final approval for commercialization. Kenya has been open to development of domestic GE products to combat drought and insect issues with local production.
The 2022 National Trade Estimate Report on Foreign Trade Barriers (p. 309) highlights issues with importation of meat, dairy, and poultry products with costly, complex, and non-transparent GoK requirements. These requirements include “Letter of No Objection to Import Permit” which requires a determination by Kenya regulatory bodies that there is a market need for the imported product. These barriers have largely blocked U.S. meat and poultry imports and are outlined in the Exporter Guide (Report Number: KE2021-0020) published in January 2022. To date, only one U.S. poultry supplier has successfully navigated Kenya’s import requirements.
Looking Ahead
As the broader Eastern Africa region suffers from extreme droughts and high fertilizer prices, Kenya will look for alternative sources of grain. The raw materials for feed include cereals, soybeans, and oilcake. Kenya typically imports raw materials from EAC and Common Market for Eastern and Southern Africa (COMESA) member states such as Uganda, Zambia, Malawi, and Tanzania, due to low tariffs, geographical proximity, and GE-free products. There is a demand for low-cost feed ingredients in Kenya and the GoK even went as far as to declare a national emergency in response to the feed crisis in the fall of 2021. This feed crisis caused the GoK to temporarily lift duties on non-GE feed products. The largest barrier for U.S. product is Kenya’s propensity to favor non-GE goods. It should be noted that feed production constraint due to pressures from climate change and increasing fertilizer prices will also put a strain on domestic meat and poultry production.
Food processing is one of the government’s priorities under its Big Four agenda aimed at improving Kenya’s manufacturing sector. In 2021, the GoK began strategizing to market and educate the population on staple food fortification with vitamins and minerals mainly focusing on corn and wheat flour, and fats and oils, creating opportunities for U.S. exports of ingredients and additives. With Kenya’s resistance to importing meat products, further strain on feed grain consumption will force Kenya to supplement supply with products that are cost-effective. The United States has had negligible exports to Kenya due to policies limiting GE grain imports and policies set in place to protect domestic agriculture. However, as the country’s middle class grows, agricultural labor decreases due to urbanization, tourism resumes after the pandemic-caused lull, and e-commerce becomes more accepted and widespread, Kenya’s desire to engage commercially with the international community will provide opportunities for the United States to expand agricultural exports.
1 Bt cotton plants contain one or more foreign gene derived from the soil-dwelling bacterium, Bacillus thuringiensis: The insertion of the genes from B. thuringiensis causes cotton plant cells to produce crystal insecticidal proteins.